


Common Core State Standards are calling for more focus on students reading charts and graphics, but new research shows engaging graphics can reduce students' understanding of chart data.
Get Started for FREE
Sign up with Facebook Sign up with X
I don't have a Facebook or a X account


 Your new post is loading...
 Your new post is loading...
Your new post is loading...
Common Core State Standards are calling for more focus on students reading charts and graphics, but new research shows engaging graphics can reduce students' understanding of chart data. 
No comment yet.
Sign up to comment
|
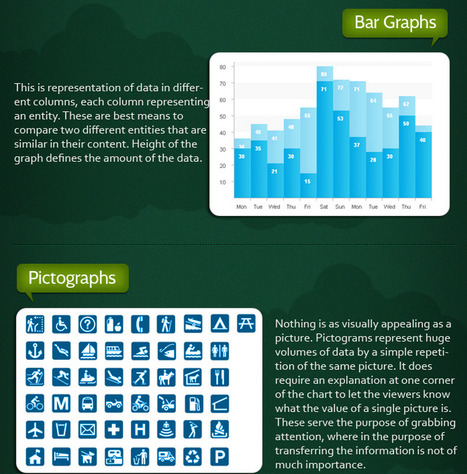
"Graphs are a visual treat, as they can present complex information in a quick and easy manner. Mostly graphs are used to reveal a trend, compare statistics or they can be even used to establish relationship between two different variables."
Beth Dichter's insight:
A great infographic that allows you to quickly compare a variety of graph types, as well as explanations about each type of graph.
|


"The common core calls for students to comprehend and connect information from visual elements, including charts, maps, and multimedia, in addition to understanding stories and informational texts." One question that comes up is how do we best teach students how to create and read graphs. This article presents information that "visually appealing graphics" may not be the best way for students to learn. By "visually appealing" they are describing graphs that use symbols, as in stacks of fruits or shoes, to represent the numbers as opposed to a bar graph.
Additional detail is provided in the article. Do you teach graphing to students in early elementary school? Reading this post may lead you to change your teaching methods (relative to graphing).