Eclectic Technology
224.6K views | +0 today
Follow
Eclectic Technology
Tech tools that assist all students to be independent learners & teachers to become better teachers
Curated by Beth Dichter
Your new post is loading...
Scooped by Beth Dichter
Scoop.it!

Discovering Stories Hidden In Numbers - Another View on Charts

Discovering Stories Hidden In Numbers - Another View on Charts | Eclectic Technology | Scoop.it

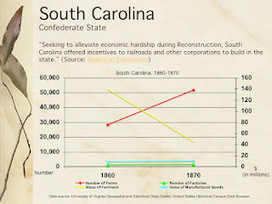
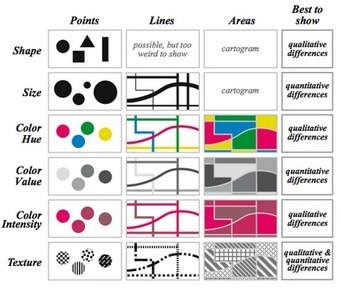
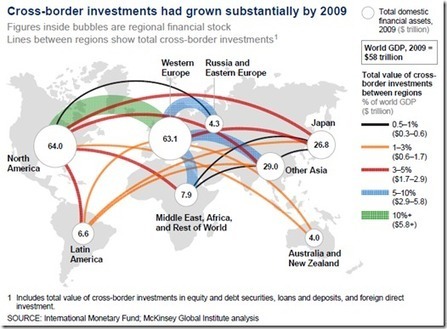
Why do we ask students to create charts? Perhaps to help them tell a story. Charts and graphs help students understand data through visualization. Many websites exist today that help students create charts and graphs. This post explores a variety of resources and shares some graphs made by 8th graders. Once again ASIDE has put together a robust post with excellent resources.

No comment yet.
Scooped by Beth Dichter
Scoop.it!

The Goldilocks Effect - Visualizing Just The Right Amount: ASIDE

The Goldilocks Effect - Visualizing Just The Right Amount: ASIDE | Eclectic Technology | Scoop.it

"Whether they realize it or not, our students are inundated with numbers. It can be hard for them to get a handle on the competing streams of information from tech and social media. One way they can learn to negotiate this "Age of Big Data" is by becoming familiar with the different types of charts and displays..."

Providing simple tools and suggestions of sites with resources this post explores the taxonomy of graphs and ways to guide students on how to look at graphs.

No comment yet.
Scooped by Beth Dichter
Scoop.it!

Chart Porn

Chart Porn | Eclectic Technology | Scoop.it
An addictive collection of beautiful charts, graphs, maps, and interactive data visualization toys -- on topics from around the world.
No comment yet.
Scooped by Beth Dichter
Scoop.it!

Resources For Introducing Students To The Advantages Of Charts, Graphs & Infographics

Resources For Introducing Students To The Advantages Of Charts, Graphs & Infographics | Eclectic Technology | Scoop.it

Larry Ferlazzo provides "a short and simple list of multimedia resources that would be useful for introducing students to the value of charts, graphs and infographics and what they mean." 

No comment yet.
Scooped by Beth Dichter
Scoop.it!

Visual literacy K-8

Visual literacy K-8 | Eclectic Technology | Scoop.it

Visual literacy has practical uses across the curriculum.

Learning science, technology, social studies, health and nutrition, history and geography, mathematics, arts and crafts all rely on visual texts such as maps, diagrams, graphs, timelines or tables.

Find many free items and ideas on this website, which is geared to Grades K - 8.

No comment yet.
Scooped by Beth Dichter
Scoop.it!

Gapminder: Unveiling the beauty of statistics for a fact based world view. - Gapminder.org

Gapminder: Unveiling the beauty of statistics for a fact based world view. - Gapminder.org | Eclectic Technology | Scoop.it
Unveiling the beauty of statistics for a fact based world view.
Marcelle Searles's curator insight, August 29, 2013 5:25 PM

Students are loving this, especially those students interested in numbers, but visual learners are also more engaged.