Eclectic Technology
224.6K views | +0 today
Follow
Eclectic Technology
Tech tools that assist all students to be independent learners & teachers to become better teachers
Curated by Beth Dichter
Your new post is loading...
Scooped by Beth Dichter
Scoop.it!

Words, Pictures, Numbers, WOW! – 2nd Grade Infographics Attract Attention

Words, Pictures, Numbers, WOW! – 2nd Grade Infographics Attract Attention | Eclectic Technology | Scoop.it

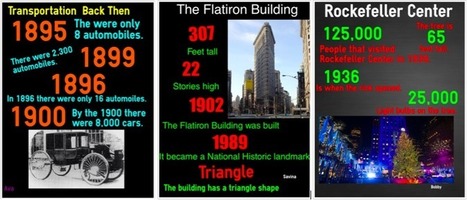
"For the past four years, we’ve been using infographics with our students at different grade levels. This year, our second graders were studying New York City to make comparisons between its historical past at the turn of the last century with today. Instead of the typical presentation poster, they made infographics using the Easelly app."

Beth Dichter's insight:

Can 2nd graders create infographics? Based on this post from ASIDE the answer would be yes! The students were able to Easel.ly and create 8 infographics that show their understanding of New York City at the turn of the century and today. Consider trying a similar project with students in your classroom (and make sure to learn to use Easel.ly before you introduce it to your students!).

No comment yet.
Scooped by Beth Dichter
Scoop.it!

Resource Roundup: The Pencil Metaphor - The Point, Labor, And Fun

Resource Roundup: The Pencil Metaphor - The Point, Labor, And Fun | Eclectic Technology | Scoop.it

"For most educators, back-to-school decorations still include the proverbial apple, school bus, writing strips, and black and white composition notebooks...

Looking back, we wanted to round up some of our favorite resources that highlight the pencil as a metaphor for leadership, work, and fun."

Beth Dichter's insight:

Perhaps you remember a few years back when the pencil became a viral hit on Twitter. Think back to the year 2011 and recall how tablets were becoming "the next best thing" in education. How was this technology going to be integrated into the school day?

This post provides a number of resources that moves the pencil beyond that viral chat. You will find an image of the pencil with each component representing various groups of people often found in schools.

The video, iPencil, takes a look at what actually goes into making a pencil, and will teach students about how one product impacts much of the world. And last, but not least,, is the Ode to #PencilChat, a short video that looks at technology integration in the classroom.

Why look at the pencil? Here are the last two lines of this post. "Whether metaphor, symbol, or tool, the pencil is flexible, durable and timeless. We wish everyone a great school year."

Melissa Marshall's curator insight, September 9, 2014 9:23 PM

The Pencil as a metaphor for educators and technology. 

I have yet to have a student ask, 'I won't do this because no-one's given me any PD.' 

Scooped by Beth Dichter
Scoop.it!

Librarians, Technology, And The New Literacies

Librarians, Technology, And The New Literacies | Eclectic Technology | Scoop.it

"The role of librarians in modern schools is more crucial than ever. In an age of dynamic information and media streams, librarians are uniquely positioned to guide students in research and storytelling tools."

Beth Dichter's insight:

This post provide a look at the many literacies that we are responsible for teaching, and although it i geared towards librarians the concepts apply to teachers across the disciplines.

Today we no longer define literacy as reading and writing. The types of literacy continue to grow and include (but are not limited to) visual, information, technological, scientific, critical, mathematical...the list goes on.

If you are looking for a short list of benefits of using technology tools, a look at how storytelling and research help students learn, or more information in the area of the new literacies in general check out this post.

Rashmi Moghe's comment, June 16, 2013 11:21 PM
Hall, Mercer and Russac, Patricia A.(2013). Librarians, technology and the new literacies. The ASIDE blog _Innovation Design In_underneath everything is information. Retrieved from http://theasideblog.blogspot.com/2013/01/librarians-technology-and-new-literacies.html
Librarians are poised to be on the front lines in delivering instruction and resources to help in understanding various literacies. They often know whole school curriculum and have the capacity to enrich daily lessons and educational units. When librarians shape information in well-conceived, visual ways, students can become motivated, self-directed learners who create their own content and publish their own work.
Scooped by Beth Dichter
Scoop.it!

Innovation Design In Education - ASIDE: Designing Infographics Easel.ly

Innovation Design In Education - ASIDE: Designing Infographics Easel.ly | Eclectic Technology | Scoop.it

Are you interested in seeing some infographics created by students using the tool Easel.ly. This post not only share some infographics created by 4th and 8th grade students using Easel.ly it also explains the parameters that were set as well as hte goal. Students were able to learn to use Easel.ly in one period, and the "only instruction given to each class was a sample infographic of what needed to be included."

Additional links to other resources is also provided, including  a link to a page that includes additional tools you might use to create infographics as well as links to a wide range of infographics based on subject.

No comment yet.
Scooped by Beth Dichter
Scoop.it!

Seeing Is Believing: Visual vs. Linear Content

Seeing Is Believing: Visual vs. Linear Content | Eclectic Technology | Scoop.it

"In order for our learners to see how designing information changes how it is viewed, the students this year placed their visual infographics side-by-side with their linear notes to see the transformation. It was the “ah ha” moment, when they could examine how the delivery of content mattered and how the deliberate choices in font hierarchy, color selection, and placement changed the way others perceived the ideas."

Beth Dichter's insight:

What a difference a visual can make? Check out the projects shown in this post. Compare the linear version (text only) with a visual that has the same information but presented in a completely different way. Which one do you think your students would be able to drawn to?

In this post ASIDE provides a bit of the history of how they have gone about teaching their students to create visuals (also known as infographics).

Along with providing the visual and the linear version of three projects they also provide two charts:

* The Elements of Design (the tools to make art)

* The Principles of Design ( how to use the tools to make art)

There are many free tools that help students create visuals. If you have been considering a project that would have your students take part in this type of project this post provides valuable information that will help the project run more smoothly.

Paul Macmullen's curator insight, October 21, 2014 6:32 PM

Useful reference for a graphically challenges creature of language such as myself :-)


WhoIsAbishag's curator insight, November 2, 2014 9:32 PM

NLP Strategies.

Ness Crouch's curator insight, July 2, 2015 10:20 PM

Visual and linear learning design should come together to create a learning tool. Infographics are an example of this. 

Scooped by Beth Dichter
Scoop.it!

If The World Were ... An Infographic

If The World Were ... An Infographic | Eclectic Technology | Scoop.it

"With the plethora of infographics in the media, it's important for our learners to understand how to design information. We continue to incorporate the creation of infographics as part of our curricula to help them do just that."

Beth Dichter's insight:

Check out this idea of one way to have your students create infographics. Using two books, 'If the World were a Village' and "If America were a Village', students were assigned a "specific aspect to address."

If having students create infographics is new to you this post provides some great ideas that you might use with your class.

The Rice Process's curator insight, January 29, 2014 7:34 AM

Designing visual representation of information is more than translating words to pictorials.  The construction involves filtering the information, drawing relationships, revealing patterns and representing the information as meaningful content. 

Scooped by Beth Dichter
Scoop.it!

Sketchnotes & Visual Thinking: A Different Way of Note-taking

Sketchnotes & Visual Thinking: A Different Way of Note-taking | Eclectic Technology | Scoop.it

This post provides a look at the "basics of sketchnoting" which you might think of as visual note-taking. Combine sketches and images, and you hvae sketchnoting, which is different than "graphic facilitation" ("one person listend to a group and graphically represents the key points of the discussion").

The post discusses note-taking in school today (which of often linear) and that students have little "interaction or engagement with the material." Sketchnoting requires "listening, thinking, and visualizing at the same time." For more information click through to the article.

No comment yet.