Eclectic Technology
224.6K views | +4 today
Follow
Eclectic Technology
Tech tools that assist all students to be independent learners & teachers to become better teachers
Curated by Beth Dichter
Your new post is loading...
Scooped by Beth Dichter
Scoop.it!

Words, Pictures, Numbers, WOW! – 2nd Grade Infographics Attract Attention

Words, Pictures, Numbers, WOW! – 2nd Grade Infographics Attract Attention | Eclectic Technology | Scoop.it

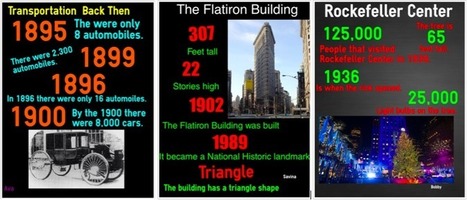
"For the past four years, we’ve been using infographics with our students at different grade levels. This year, our second graders were studying New York City to make comparisons between its historical past at the turn of the last century with today. Instead of the typical presentation poster, they made infographics using the Easelly app."

Beth Dichter's insight:

Can 2nd graders create infographics? Based on this post from ASIDE the answer would be yes! The students were able to Easel.ly and create 8 infographics that show their understanding of New York City at the turn of the century and today. Consider trying a similar project with students in your classroom (and make sure to learn to use Easel.ly before you introduce it to your students!).

No comment yet.
Scooped by Beth Dichter
Scoop.it!

Content and Design: Pushing Learners Beyond Mediocrity

Content and Design: Pushing Learners Beyond Mediocrity | Eclectic Technology | Scoop.it

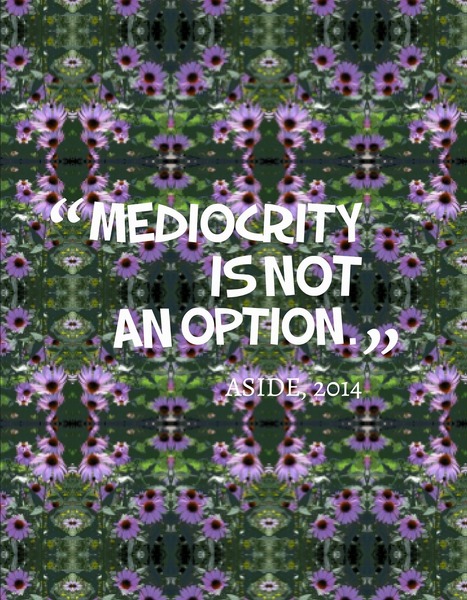
"In today’s world of fast-paced touch screens, snaps, clicks, and tweets, we increasingly find it difficult to get our learners to see that design and presentation matter. We are not sure if this is the result of the over-scheduled child jumping from one activity to another, or the increasingly shorter attention span to stay with something to make it their absolute best. Now more than ever before, content and design matter in tackling a problem, iterating an idea, building a prototype, or constructing a presentation."

Beth Dichter's insight:

This post explores how students are often satisfied with work that we know does not meet our standards (or their potential). Although we provide clear expectations, detailed rubrics, model the work there are many times that the quality is not what we had hoped for. 

Can teaching design make a difference? Can we work with out students and over time move them so that they will not accept mediocrity as their best work? Starting at a young age can we instill a growth mindset so that students understand that effort is required to learn and to do your best? Can we move away from empty platitudes and provide feedback that is clearly stating what they did and also what is missing? 

How do you deal with these issues in your classes? What has worked for you when you have students who are happy with mediocrity? Share your thoughts.

No comment yet.
Scooped by Beth Dichter
Scoop.it!

Seeing Is Believing: Visual vs. Linear Content

Seeing Is Believing: Visual vs. Linear Content | Eclectic Technology | Scoop.it

"In order for our learners to see how designing information changes how it is viewed, the students this year placed their visual infographics side-by-side with their linear notes to see the transformation. It was the “ah ha” moment, when they could examine how the delivery of content mattered and how the deliberate choices in font hierarchy, color selection, and placement changed the way others perceived the ideas."

Beth Dichter's insight:

What a difference a visual can make? Check out the projects shown in this post. Compare the linear version (text only) with a visual that has the same information but presented in a completely different way. Which one do you think your students would be able to drawn to?

In this post ASIDE provides a bit of the history of how they have gone about teaching their students to create visuals (also known as infographics).

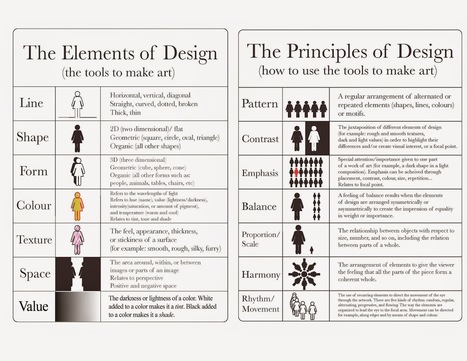
Along with providing the visual and the linear version of three projects they also provide two charts:

* The Elements of Design (the tools to make art)

* The Principles of Design ( how to use the tools to make art)

There are many free tools that help students create visuals. If you have been considering a project that would have your students take part in this type of project this post provides valuable information that will help the project run more smoothly.

Paul Macmullen's curator insight, October 21, 2014 6:32 PM

Useful reference for a graphically challenges creature of language such as myself :-)


WhoIsAbishag's curator insight, November 2, 2014 9:32 PM

NLP Strategies.

Ness Crouch's curator insight, July 2, 2015 10:20 PM

Visual and linear learning design should come together to create a learning tool. Infographics are an example of this. 

Scooped by Beth Dichter
Scoop.it!

If The World Were ... An Infographic

If The World Were ... An Infographic | Eclectic Technology | Scoop.it

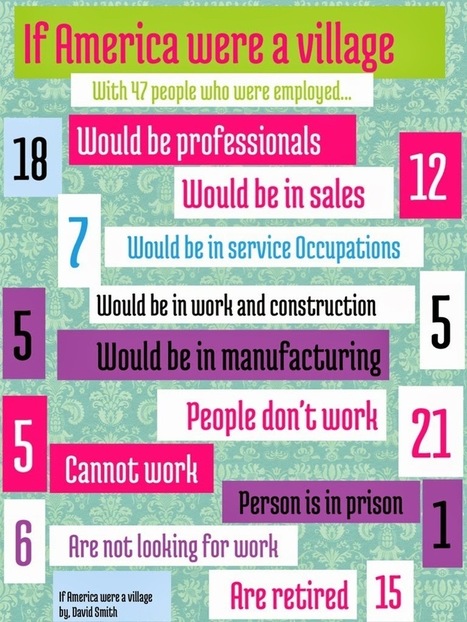
"With the plethora of infographics in the media, it's important for our learners to understand how to design information. We continue to incorporate the creation of infographics as part of our curricula to help them do just that."

Beth Dichter's insight:

Check out this idea of one way to have your students create infographics. Using two books, 'If the World were a Village' and "If America were a Village', students were assigned a "specific aspect to address."

If having students create infographics is new to you this post provides some great ideas that you might use with your class.

The Rice Process's curator insight, January 29, 2014 7:34 AM

Designing visual representation of information is more than translating words to pictorials.  The construction involves filtering the information, drawing relationships, revealing patterns and representing the information as meaningful content.