


 Your new post is loading...


|
Scooped by Beth Dichter |

Beth Dichter's insight:
Richard Byrne shares seven free tools to help create graphs and charts. Check out the list below and click through to the post for additional information on each tool.
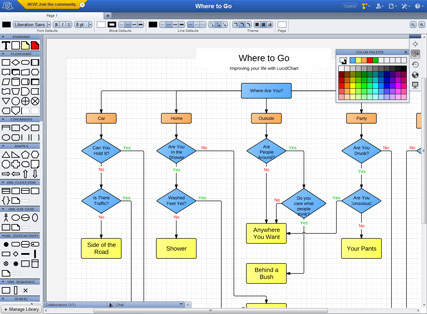
* LucidChart - available free to schools and also as a Google app
* Google Fusion Tables - a spreadsheet app that allows you " to create visualizations of data set comparisons"
* Hohli Online Chart Builders - allows you to create "a variety of charts for online display"
* Infogr.am - " an online tool for creating interactive charts and graphs to use in interactive infographics"
* Better World Flux - this was created for the World Bank and "allows users to create animated visualizations of development data"
* Gapminder - also allows for data visualization and provides a page for educators
* Haiku's Deck Web App - Haiku Deck continues to add new features and now provides the ability to create graphs and charts
As always it pays to check out each tool and determine which you think will best meet the needs of your class (and that may be a choice of more than one).


Beth Dichter's insight:
Richard Byrne shares seven free tools to help create graphs and charts. Check out the list below and click through to the post for additional information on each tool.
* LucidChart - available free to schools and also as a Google app
* Google Fusion Tables - a spreadsheet app that allows you " to create visualizations of data set comparisons"
* Hohli Online Chart Builders - allows you to create "a variety of charts for online display"
* Infogr.am - " an online tool for creating interactive charts and graphs to use in interactive infographics"
* Better World Flux - this was created for the World Bank and "allows users to create animated visualizations of development data"
* Gapminder - also allows for data visualization and provides a page for educators
* Haiku's Deck Web App - Haiku Deck continues to add new features and now provides the ability to create graphs and charts
As always it pays to check out each tool and determine which you think will best meet the needs of your class (and that may be a choice of more than one).
7 Online Tools for Creating Charts & Diagrams