Let’s be honest, we don’t like to read big pieces of text. Text-heavy graphs are rather difficult for understanding, especially when dealing with numbers and statistics. That is why illustrations and flowcharts are often used for such kind of information.
An infographic, or a visual representation of study or data, like anything else, can be done right or wrong. How to create a successful infographic? A good idea and a good design.
Stop by the link for more on what defines an infographic, what contributes to its popularity, as well as the various types of infographics and references for tutorials and best practices.
Additional topics covered include:
The major parts of an infographic How to create an infographic Developing ideas & organizing data Research & sources Typography, graphics & color Facts & conclusions Designing & Editing
Via
Lauren Moss,
Gust MEES


 Your new post is loading...


![What Is A Flipped Classroom? (Updated For 2012) [Infographic] | Dyslexia, Literacy, and New-Media Literacy | Scoop.it](https://img.scoop.it/gVw4hb_jW4A-CzGOEswW8Tl72eJkfbmt4t8yenImKBVvK0kTmF0xjctABnaLJIm9)


![Why You Should Care About Mobile Security [INFOGRAPHIC] | Dyslexia, Literacy, and New-Media Literacy | Scoop.it](https://img.scoop.it/bCDzCBQu4qMgWJAbygdm2jl72eJkfbmt4t8yenImKBVvK0kTmF0xjctABnaLJIm9)


![10 Amazing Social Media Statistics [INFOGRAPHIC] | Dyslexia, Literacy, and New-Media Literacy | Scoop.it](https://img.scoop.it/w7o92dIBdem4QnASs1Hy2Dl72eJkfbmt4t8yenImKBVvK0kTmF0xjctABnaLJIm9)


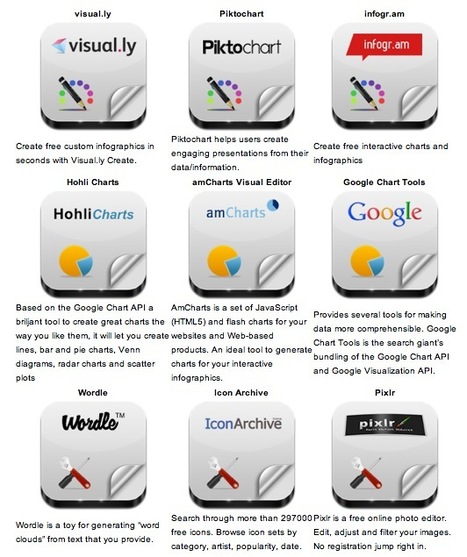
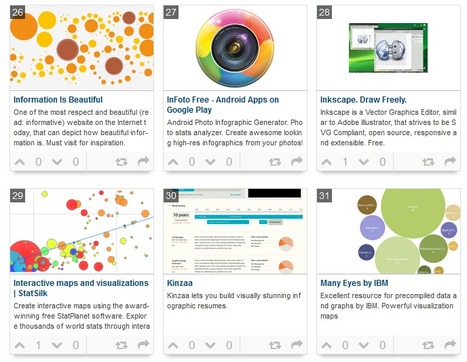
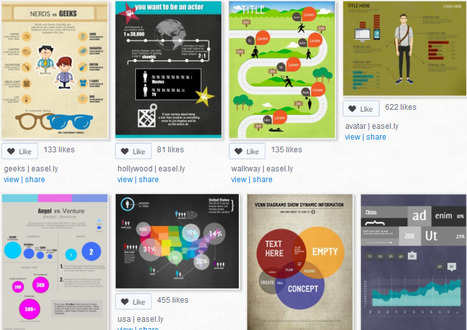
Good tools to make Infographics
Infographics voor zij die er nog steeds zot van zijn.
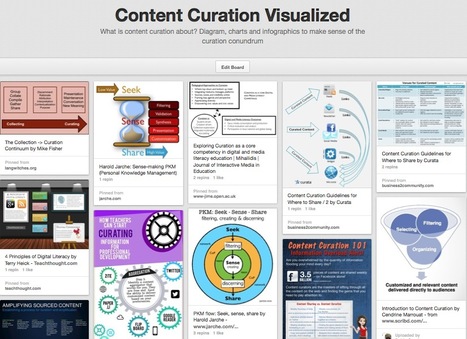
Infographics are great tools to present curated and focused content from a specific perspective.