

A foreign language teacher provides her ideas and examples for using infographic timelines in the classroom, both as assignments and visual aids.
Get Started for FREE
Sign up with Facebook Sign up with X
I don't have a Facebook or a X account


 Your new post is loading...
 Your new post is loading...
Your new post is loading...
A foreign language teacher provides her ideas and examples for using infographic timelines in the classroom, both as assignments and visual aids.
Baiba Svenca's insight:
Great tips for students who need to create timelines. Experience shared by a foreign language teacher. Thanks for the suggestion to April Alen Abion. 
A guide to creating accurate and effective charts and graphs, with a checklist of the most common errors and how to avoid them.
Baiba Svenca's insight:
Excellent tips for making charts that look professional.

Jim George's curator insight,
September 1, 2016 9:59 AM
Some excellent tips to spruce up the old visuals!

La pluma digital's curator insight,
October 31, 2016 10:12 AM
Una guía para elaborar gráficos no solo fáciles de leer, sino también atractivos para el usuario.
A short tutorial for beginners on how to create a simple infographic with Visme.
Baiba Svenca's insight:
If you want to learn how to make infographics, this is your tutorial.
Learn how to create an infographic from an infographic: This interactive breaks down the process of designing an infographic into 5 easy to understand steps
Baiba Svenca's insight:
If you have been thinking about creating your first infographic, here are some useful guidelines how to do it. Thanks for the suggestion to Payman Taei.

Raquel Oliveira's curator insight,
June 9, 2015 8:10 PM
Infografico é uma excelente ferramenta visual para desenho instrucional #avancee Simplificar esse processo é o MUST! 
Sue Alexander's curator insight,
June 22, 2015 9:02 AM
This is a wonderful graphic; you get great content presented with clarity and flair. WTG visme. I can run with this.
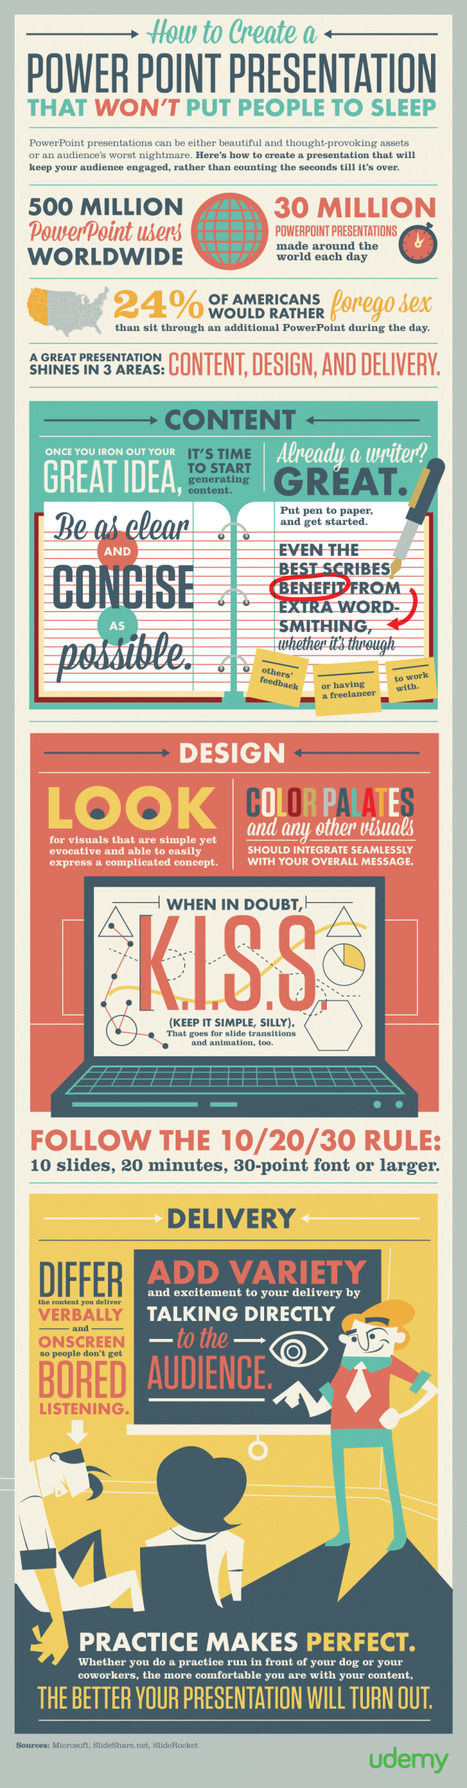
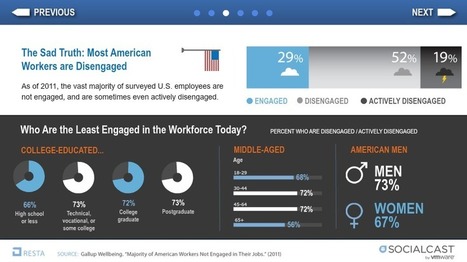
Before a presentation your nerves become fired up and your heart starts to pound. While the audience may be sizing you up, they are only hoping for an engaging presentation. They want you to succeed and quite frankly they need you to succeed. The infographic provided by Udemy walks us through the three critical points to creating a great presentation.
Baiba Svenca's insight:
Attractive and informative infographic on PowerPoint presentations. Thanks for the suggestion to Ivo Novy.

Fenia's curator insight,
March 24, 2015 2:37 PM
Useful guide to good presentations - not only for ppt but also for other presentation tools
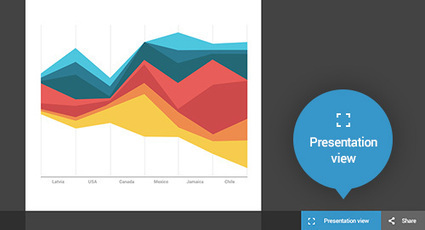
We have redesigned Infogram page by page to reflect your feedback and improve your experience. A few significant changes you’ll notice when logged-into the infographic editor
Baiba Svenca's insight:
Infogram have updated their site to enable presentation view of the charts and infographics. There are also lots of minor changes that improve the process of creation.

Sprites is a free tool for creating beautiful animated infographics for the Web.
Baiba Svenca's insight:
Sprites is a cool new HTML5 - based tool for creating infographics. There are free and paid versions but at this moment you can sign up for a free pro account.

Erin Walsh's curator insight,
May 22, 2014 2:55 PM
Infographics are a great way to grab someones attention and get your information out there 
Marja Oilinki's curator insight,
May 23, 2014 5:21 AM
Toistaiseksi Pro-versiona ilmainen melkoisen intuitiivisesti toimiva ja tyylikäs infografiikkatyökalu Sprites sopii yhteen Googlen työkalujen kanssa. Esimerkiksi tilaston muuttaminen havainnolliseen muotoon on todella helppoa. 
BI Media Specialists's curator insight,
May 30, 2014 7:54 AM
I love an infographic! Such a great way to get information across to visual learners. Right now you can sign up for a free pro account!

From
vizalizer

Vizalizer simplifies the creation, analysis and generation of data visualization through a Social Network that brings together publishers with colleagues and readers, to create content for its analysis and discussion, use in presentations, publications...
Baiba Svenca's insight:
Vizalizer is an interesting tool that lets you create infographics and data visualizations. In my opinion, it is more suitable for business but ingenious people may find how to use it in education as well. The basic version is free but it has limitations.
Baiba Svenca's insight:
Piktochart has recently been upgraded, and now it makes infographics and presentations more interactive. You can now insert hyperlinks in your content and make your charts and tabs interactive. Also it is easier to save and share your infographics. Unfortunately, free account is very limited, it gives you only 4 basic themes to choose from. Paid accounts for students start at $3.33 per month. Check out Piktochart for education http://piktochart.com/education/
You can create infographics - visual representations of data - from scratch using free web tools. Library consultant and educator Linda W. Braun takes you step by…
Baiba Svenca's insight:
Great detailed tutorial on how to create infographics using two popular tools - http://www.easel.ly/ and http://infogr.am.

Alfredo Corell's curator insight,
December 29, 2012 11:48 AM
Very good and detailed tutorial for creating infographics
Learn how to create stunning infographics - without spending hundreds of dollars on a graphic designer or losing your mind - in just 30 minutes or less.
From word clouds to network data visualizations, infographics have become a primary format for content in a relatively short period of time. Although the ‘infographic’ is nothing new, its proliferation and evolution has been nothing short of exponential in the past few years. Whether you love them or hate them, the rising popularity of infographics can’t be denied.

Jeff Domansky's curator insight,
January 7, 2013 4:29 PM
Really excellent how-to using the impressive Piktochart infographic tool. 
Neil Ferree's curator insight,
February 26, 2013 10:05 AM
Infographics done right and done well can generate lots of traffic to your http://bit.ly/RichSnippet and build your brand
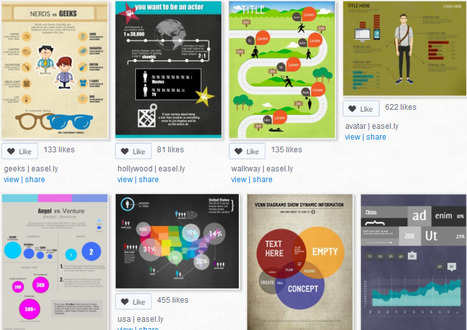
An easy way to create infographics and posters with ready-made visual themes - vhemes.
Alfredo Corell's comment,
November 13, 2012 2:30 AM
Everybody could be relaxed... it's finally working back. Enjoy!!!

Nuava Solutions's curator insight,
December 19, 2012 10:35 AM
For more information on Online Solutions, please visit our website or contact us. 
Cb Bowman's curator insight,
September 10, 2013 12:31 PM
The current wave in marketing and/ or knowledge sharing.

From simple charts to complex maps and infographics, Brian Suda's round-up of the best – and mostly free – tools has everything you need to bring your data to life... A common question is how to get started with data visualisations. Beyond following blogs, you need to practice – and to practice, you need to understand the tools available. In this article, get introduced to 20 different tools for creating visualisations... Via Lauren Moss

Randy Rebman's curator insight,
January 28, 2013 12:33 PM
This looks like it might be a good source for integrating infographics into the classroom. |

A list of visual content types you probably haven't tried yet, from cinemagraphs and progress GIFs to interactive sliders and mixed-media infographics.
Baiba Svenca's insight:
Fantastic visuals + tips how to create them.
A hand-picked list of animated and interactive infographics that incorporate innovative and impressive design elements, motion graphics and effects.
Baiba Svenca's insight:
If you want to make your presentations more attractive, include infographics. Or present infographics alone.
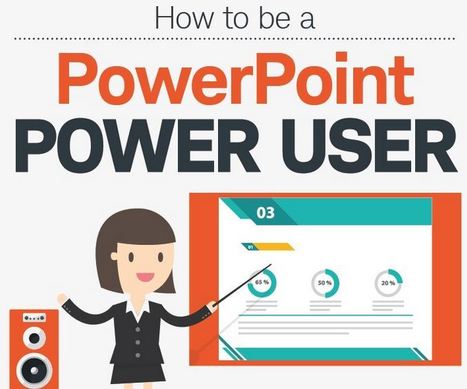
Got a presentation to prepare for? Want to avoid 'Death by PowerPoint'? Then read on, we've polled some PowerPoint experts for their tried and tested PowerPoint tips. You'll even discover how to partner PowerPoint with best of breed presentation productivity apps to ensure you are prepared for any occasion.
Baiba Svenca's insight:
A great infographic - 7 tricks to help you become an expert user of PowerPoint.

Wendy Zaruba's curator insight,
February 2, 2016 10:27 AM
More great tips for using PowerPoint, check them out!
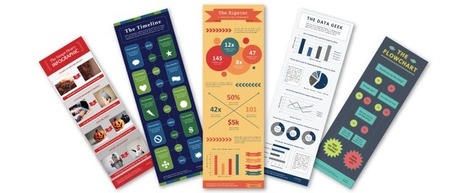
Learn how to easily create professional-looking infographics in PowerPoint with these 10 free templates.
Baiba Svenca's insight:
This is a helpful post for those who would like to make infographics in Powerpoint. You can also download 10 free templates.

No Boxes's curator insight,
May 18, 2015 5:25 PM
I love infographics! Thanks to HubSpot for sharing these. 
Sally Spoon's curator insight,
August 6, 2015 12:18 AM
This is a helpful post for those who would like to make infographics in Powerpoint. You can also download 10 free templates.
How to create an amazing infographic with Visme in just 9 steps.
Baiba Svenca's insight:
9 steps how to create infographics, well-presented and concise. Thanks for the suggestion to Payman Taei.

Professional infographic designers rely primarily on a core vector graphics software program to create their infographics designs. The main advantage is that all the icons, charts, images, illustrations, and data visualizations are treated as separate objects that can be easily moved, resized, overlapped, and rotated.
Baiba Svenca's insight:
Wonderful and easy tools for creating infographics and presentations. Start using any of them for free, then go to a paid version if you wish.

Melissa Marshall's curator insight,
October 15, 2014 12:56 AM
These tools are mostly web-based and provide ways in which students can visually represent their ideas. 
Stephan Hughes's curator insight,
October 21, 2014 9:27 AM
Getting students to create infographics and using them ourselves to present information are more than justifiable reasons for these kind of tools
From
infogr
Create infographics and interactive online charts. It's free and super-easy! Follow other users and discover amazing data stories!
Baiba Svenca's insight:
Infogr.am now enables you to create interactive charts and infographics in Excel to visualize your information. You will need Microsoft Office 2013 to use this free application.

Sarah Bylsma's curator insight,
July 27, 2013 10:19 PM
Great cross literacy tool (geography,math etc.) I can't wait to share with my tweets
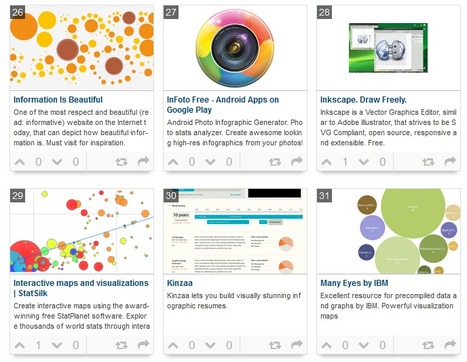
Infographics are interesting–a mash of (hopefully) easily-consumed visuals (so, symbols, shapes, and images) and added relevant character-based data (so, numbers, words, and brief sentences). The learning application for them is clear, with many academic standards–including the Common Core standards–requiring teachers to use a variety of media forms, charts, and other data for both information reading as well as general fluency...
Baiba Svenca's insight:
A goldmine of 46 tools that will help you make infographics. The list has been put together by Faisal Khan. You can use these tools not only for creating infographics but also use them for charts, diagrams, mind maps etc.

maite collados's curator insight,
January 14, 2014 11:24 AM
Las infografías son una herramienta muy útil por su factor visual: en poco espacio y de forma visulamente agradable y atrayente, engloba datos y relaciona conceptos. 
ManufacturingStories's curator insight,
July 30, 2014 7:50 AM
For more resources on Social Media & Content Curation visit http://bit.ly/1640Tbl
InformationGraphics a.k.a. Infographics
Baiba Svenca's insight:
A neat presentation on infographics, appropriate for beginners and students who just want to start with their first infographic. The slideshow gives the definition, types and examples of various infographics.

Warren Williams's curator insight,
February 16, 2013 5:04 PM
Good for beginners to understand where and how to start
Graphs provide visual representation of data and are much easier and quicker to comprehend than boring digits or plain text. Graphs are used to show progress or regress or compare statistics. There are different types of graphs and each one can be used to present the data in a different perspective.
Infographic on learning about what are types of graphs with respect to education in Line Graph, Bar Graph, Pictographs, Pie Charts, Organizational Charts, Flow Charts, Bubble Chart, Area Graphs, Waterfall Chart...
Baiba Svenca's insight:
A useful infographic showing all types of graphs which are essential components of presentations dealing with data. Thanks to Chintan Jain for suggesting this resource.

Susan Gingras Fitzell's curator insight,
December 27, 2012 6:29 PM
Reading graphs is a skill critical to all content areas. This infographic provides a powerful visual mnemonic to support student recall.
There's no denying infographics are great to communicate data in an engaging, easy to understand way.
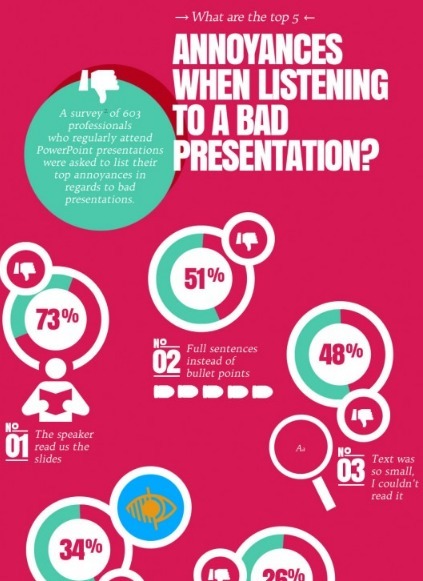
How much money is lost every day because of bad presentations? Top 5 annoyances when listening to a bad presentation.
|


Great tips for students who need to create timelines. Experience shared by a foreign language teacher.
Thanks for the suggestion to April Alen Abion.