Digital Presentations in Education
764.3K views | +0 today
Follow
Digital Presentations in Education
Everything for and about presentations - online tools, apps, tips and tutorials, slide design
Curated by Baiba Svenca
Your new post is loading...
Scooped by Baiba Svenca
Scoop.it!

yEd - Graph Editor

yEd - Graph Editor | Digital Presentations in Education | Scoop.it

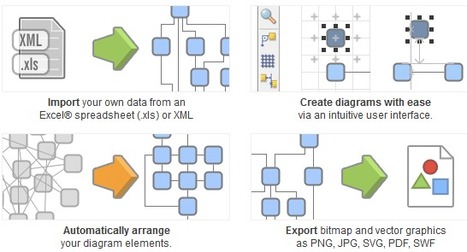
yEd is a powerful desktop application that can be used to quickly and effectively generate high-quality diagrams. Create diagrams manually, or import your external data for analysis. Our automatic layout algorithms arrange even large data sets with just the press of a button.

Baiba Svenca's insight:

yED software is free to download, it works on all platforms and helps you create beautiful diagrams using ready-to-use elements. Import your data, including from Excel, and export your diagrams in a wide range of graphics formats.

Karen Lopez's curator insight, August 9, 2013 11:48 AM

Engaging and super fun!

Marie-Chantal SCHMITZ's curator insight, August 27, 2013 9:00 AM

Pour les professeurs ou les élèves qui souhaitent agrémenter leurs documents de graphiques soignés

Suggested by Christino Martin
Scoop.it!

What are the Types of Graphs

What are the Types of Graphs | Digital Presentations in Education | Scoop.it

Graphs provide visual representation of data and are much easier and quicker to comprehend than boring digits or plain text. Graphs are used to show progress or regress or compare statistics. There are different types of graphs and each one can be used to present the data in a different perspective.


Infographic on learning about what are types of graphs with respect to education in Line Graph, Bar Graph, Pictographs, Pie Charts, Organizational Charts, Flow Charts, Bubble Chart, Area Graphs, Waterfall Chart...

Baiba Svenca's insight:

A useful infographic showing all types of graphs which are essential components of presentations dealing with data.

Thanks to Chintan Jain for suggesting this resource.

Susan Gingras Fitzell's curator insight, December 27, 2012 6:29 PM

Reading graphs is a skill critical to all content areas. This infographic provides a powerful visual mnemonic to support student recall.

Scooped by Baiba Svenca
Scoop.it!

Polychart: Create Awesome Charts For PowerPoint

Polychart: Create Awesome Charts For PowerPoint | Digital Presentations in Education | Scoop.it

Polychart is a free web service that lets you easily create Dashboards and charts from your existing database. It conveniently connects directly to where you store your data and works in browsers and on tablets so you can create charts and diagrams anywhere you are. You can also export your charts to PowerPoint, PDF and image formats.

Baiba Svenca's insight:

Read the review of Polychart which is a tool that lets you create and customize charts from your own data. Export your charts to PowerPoint, download as image or PDF.

Watch the demo video that explains how to use Polychart https://www.polychart.com/

Lynn M. Miller's curator insight, June 22, 2013 12:15 PM

Great article! *Professionalism with a Flair! #lmallc

Wayne Turner's curator insight, June 23, 2013 11:08 AM

I'm always looking for ways to graphically present complex information.