

You don’t need to be a seasoned data scientist or have a degree in graphic design in order to create incredible data visualisations.
Get Started for FREE
Sign up with Facebook Sign up with X
I don't have a Facebook or a X account


 Your new post is loading...
 Your new post is loading...
Your new post is loading...
You don’t need to be a seasoned data scientist or have a degree in graphic design in order to create incredible data visualisations.
Baiba Svenca's insight:
A great list of tools for creating visual content (diagrams, charts, infographics, word clouds, maps etc.) for your presentations. 
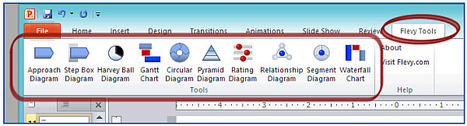
Flevy Tools is a free PowerPoint plugin that provides a set of automated diagramming tools for Waterfall Charts, Approach Diagrams, Step Box Diagrams, Harvey Ball Diagrams, Gantt Charts, Circular Approach Diagrams, Pyramid Diagrams, Relationship...
Baiba Svenca's insight:
Hurry to download PowerPoint plugin that makes all kinds of diagrams while it is free, you just have to share the site on social networks.
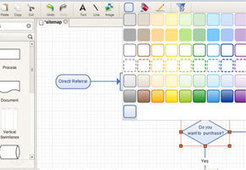
An online diagramming software perfect for classroom collaboration and project work. Students can create and collaborate on all kinds of visual graphic organizer templates as well as mindmap, fishbone diagrams and other class assignments.
Baiba Svenca's insight:
If you are not acquainted with Creately, it is high time you were. It is a wonderful tool not only for making diagrams, but also for drawing mind maps, creating storyboards, T-charts, collaborative class projects etc. If your diagrams are public, you can make five for free. If you use Creately in education, you can get it for special educational rates.

Terry Hollis's curator insight,
May 5, 2020 10:31 PM
A concept mapping tool that allows students to create story boards, Venn diagrams, Mind maps and more. Features thousands of templates that can be subject specific. It allows for online collaboration which can be a great for group work/tasks for students.
Create, embed and share your charts, plots, diagrams and maps online.
Baiba Svenca's insight:
Chartle is a free interactive chart creation tool using Java which works online, you don't need to download it. No registration. When your chart is ready, you can publish it or embed it on your website. Because of its simplicity, it is great for using with students.

Christine Bushong's curator insight,
March 19, 2013 9:25 AM
Free. No registration. Publish or embed.

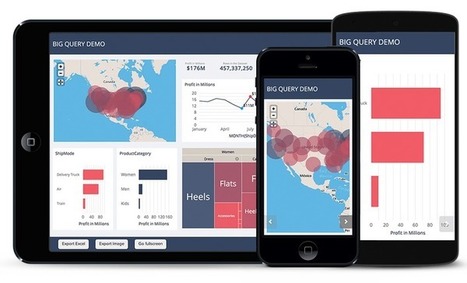
iCharts accelerates data storytelling with simplistic, interactive, visualization tools for big and small data providers.
Baiba Svenca's insight:
iCharts helps you make great-looking charts quickly and easily. Load your data from multiple sources, design and publish your chart. To learn how to use iCharts, watch User Guide http://www.icharts.net/user-guide Basic account is free.

Sue Gould's curator insight,
March 6, 2013 6:34 PM
There is an emerging learning trend towards visual stimulus as a result of growing up with videos, TV, and technology from barbie laptops to Ipads. This is a great resource for tutors to reach this audience while using few words. 
Robert Sims's curator insight,
March 15, 2013 5:07 PM
Here's a great tool for building up the Taxonomy usage in your classroom!
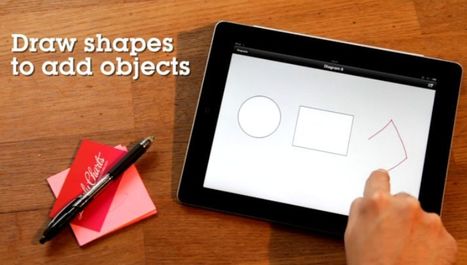
![Lekh Diagram: Easily Create All Types Of Diagrams, Flow Charts, & Mind Maps [iPad] | Digital Presentations in Education | Scoop.it](https://img.scoop.it/92dDkaJ6m3ti2UPAU3_Ycjl72eJkfbmt4t8yenImKBVvK0kTmF0xjctABnaLJIm9)
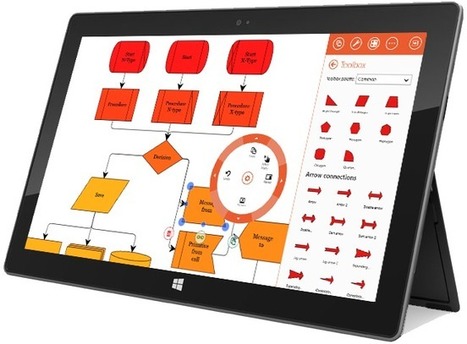
...Mostly people create these charts through computer applications. A few presenters use web applications since there has been a recent emergence of online diagram creators. But if you are always on the go and you need a highly accessible diagram creator, then you should go for the smart device application called Lekh Diagram.

Baiba Svenca's comment,
December 11, 2012 3:13 PM
This tool looks extremely friendly letting you draw a diagram or a mind map just using your finger, so if you have an iPad, give it a go!

Gliffy.com is a web-based diagram editor. Create and share flowcharts, network diagrams, floor plans, user interface designs and other drawings online.
Create a graph online quickly. Create bar graphs, line graphs or pie charts. Simply choose your settings, paste your data in the Chart data area and hit the create button. Visit the menu section if you need more specific chart settings.
Diagramly is a capable online diagramming tool, it’s free and can produce fairly complex diagrams and charts...

Human Interest Agency- Child Support Enforcement's curator insight,
September 6, 2016 8:09 PM
HIATX.com
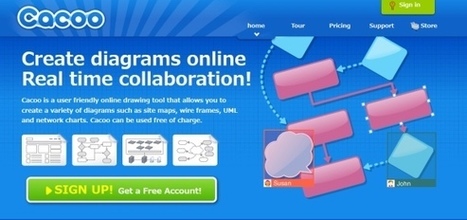
Cacoo enables creating both diagrams and presentations online, which can be saved in Microsoft PowerPoint and other formats...
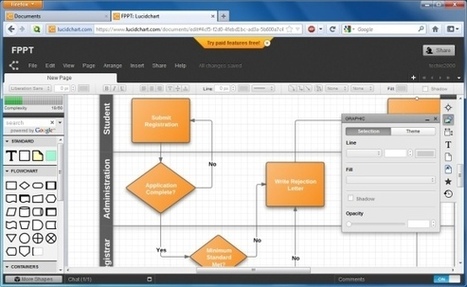
Lucid Chart is an online platform for creating powerful diagrams and flowcharts that can be used for creating presentations and for visual communication with your audience.
From
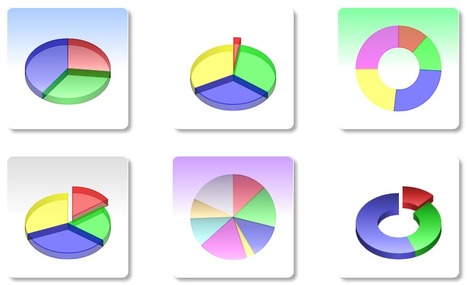
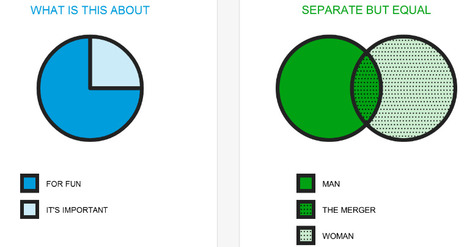
piecolor

A simple tool that creates color pie chart. This generator will produce an image that you can download.
|

"Through the Free Technology for Teachers Facebook page I recently received a request for some suggested online chart creation tools..."
Baiba Svenca's insight:
Once again, here is a list of online tools for creating charts and diagrams compiled by Richard Byrne. You may discover a new tool unknown to you before.

Gust MEES's curator insight,
February 11, 2015 11:13 AM
Lucidchart is an easy tool to use to create flowcharts, mindmaps, and graphic organizers. Lucidchart offers a simple drag and drop interface for creating flow charts, organizational charts, mind maps, and other types of diagrams. To create with Lucidchart just select elements from the menus and drag them to the canvas. You can re-size any element and type text within elements on your chart. Arrows and connecting lines can be re-sized, repositioned, and labeled to bring clarity to your diagrams. Find out more tools by visiting the article...
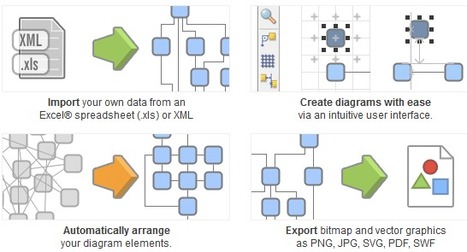
yEd is a powerful desktop application that can be used to quickly and effectively generate high-quality diagrams. Create diagrams manually, or import your external data for analysis. Our automatic layout algorithms arrange even large data sets with just the press of a button.
Baiba Svenca's insight:
yED software is free to download, it works on all platforms and helps you create beautiful diagrams using ready-to-use elements. Import your data, including from Excel, and export your diagrams in a wide range of graphics formats.

Marie-Chantal SCHMITZ's curator insight,
August 27, 2013 9:00 AM
Pour les professeurs ou les élèves qui souhaitent agrémenter leurs documents de graphiques soignés
What do you use when you need to draw a diagram? Do you do the whole thing from scratch? Do you create each and every box with a series of four lines, or do you use a program that creates the box for you?
Baiba Svenca's insight:
Cacoo is a mind mapping application that has been around for a while and now you can enjoy its services through Google Drive. Add the app to your GD (read the instructions how to do it) and start creating mind maps right in your Google Drive. The basic account is free and in my opinion it is sufficient for educational purposes. You can make 25 sheets of diagrams. Free account lets you export your diagrams as PNG images.

Charts are a great tool because they communicate information visually. On Onlinecharttool.com you can design and share your own charts online and for free. We support a number of different chart types like: bar charts, pie charts, line charts, bubble charts and radar plots.
Baiba Svenca's insight:
Chart Tool is the easiest and fastest web application for creating different charts to be used in your presentations. No registration is required. Build your chart and download it in various formats or send it to anyone by email. Chart tool is free to use.

Tom Perran's curator insight,
March 6, 2013 8:47 PM
Nice to have all of these different charts in one place.
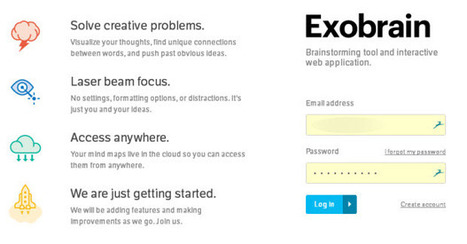
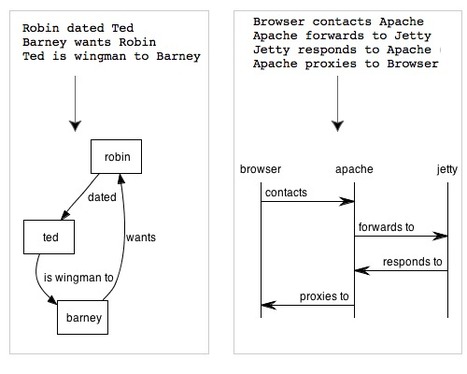
Keeping the idea flowing can be really more difficult than it sounds. We get easily distracted, and the chain of thoughts will be lost forever. It would help to write them down but more often than not they are just abstract notions in our heads. Beyond a point things get complicated and even you can’t understand what is in there.
Baiba Svenca's insight:
The article explains how to do mind mapping using Exobrain. The application produces a diagram which is easy to manage. Link to Exobrain website https://www.exobrain.co/

Lance Yoder's comment,
January 8, 2013 12:23 PM
I had a hard time getting exobrain to do anything at all. Anyone else?
Baiba Svenca's comment,
January 8, 2013 12:50 PM
I've tried it. It works exactly as one would expect a plain and basic tool to work. It is not suitable for elaborate mind maps or diagrams but for young students it may work fine.
Grapholite is an easy-to-use and still comprehensive online solution to design professional-looking flowcharts, organizational charts, mind maps, Venn charts, database structures, web-site structures, etc. that can be used online and offline, in and out of browser; created diagrams can be stored locally and on the server.
Supports IE, Chrome, Firefox and Safari on Mac, WinXP, Win7 and Win8.
Baiba Svenca's insight:
To test the tool, you can use demo mode. The tool produces beautiful and detailed mind maps and diagrams.

Janek Wagner's comment,
December 12, 2012 3:28 AM
LOL: This application requires you to update your browser with the Microsoft Silverlight plug-in.
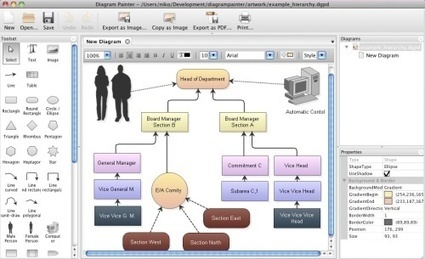
With DiagramPainter, you can quickly draw flowchart diagrams, mind mappings, organization charts, and more. With a few clicks, you can then integrate the diagram in your favourite program, by copying it to the clipboard as image, or saving it as file... Free trial.

Kshitija's curator insight,
December 22, 2012 6:21 AM
A useful tool for all business executives who regularly make complex or data presentations. The tool helps you make flowchart diagrams, mind maps and even organization charts. It can save your diagram in various formats like .jpg or .png You can also try using editable PowerPoint diagrams specially designed for business users. You can use such diagrams as is or edit them to suit your style. Take for example a MindMap and see how it is used to show how to Strike a Balance in Life - http://www.24point0.com/product-reviews-and-applications/easy-to-download-edit-%E2%80%93-mind-map-diagram-for-ppt-presentations/
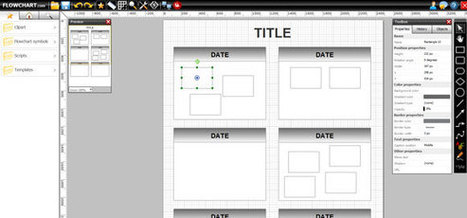
FlowChart is another free tool that you can use to make online diagrams and then share online with your colleges...

Progressive training's curator insight,
October 29, 2013 8:14 AM
Free tool to make diagrams online
#presentations
It's FREE and Open Source (GPL).
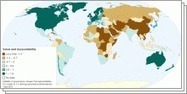
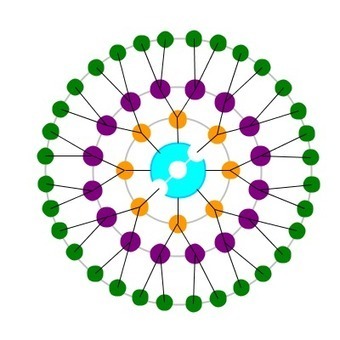
ChartsBin is a web-based data visualization tool that will allow everyone to quickly and easily create rich interactive visualizations with their own data... Download charts from the extensive chart library or create your own.
Lovely Charts is an online diagramming application that allows you to create professional looking diagrams, such as flowcharts, sitemaps, organisation charts, wireframes, and many more...
|


Ca donne envie d'essayer : nuage de mots, graphiques, cartes... Par Christopher Ratcliff @ Econsultancy publié le 25/02
Check out how to add visualisations to your presentations.
197