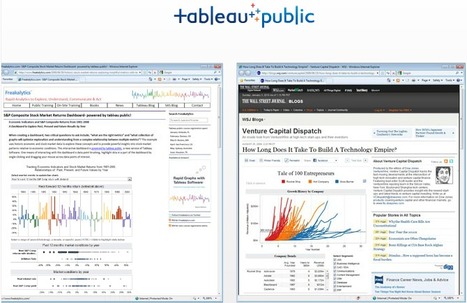
Tableau Public is a free tool that brings data to life. Easy to use. Spectacularly powerful. Data In. Brilliance Out.
Research and publish the best content.
Get Started for FREE
Sign up with Facebook Sign up with X
I don't have a Facebook or a X account
Already have an account: Login
Everything for and about presentations - online tools, apps, tips and tutorials, slide design
Curated by
Baiba Svenca
 Your new post is loading... Your new post is loading...
 Your new post is loading... Your new post is loading...
|
himanshi lamba 1's comment,
August 29, 2016 1:54 PM
Hey, really interesting post!
I agree with you that Business Intelligence (BI) is a set of tools and techniques that process raw data into meaningful information and useful statistics that are used in business analysis, which can help in achieving beneficial results. Here I need to mention a very useful BI tool that helped me a lot in successfully visualizing my data. Tableau is a very well-known BI tool that creates visualization for data and enables users to communicate with the data to make effective decisions. Have a look at http://www.actiknow.com/tableau-consulting/ to get knowledge about this tool. |


I agree with you that Business Intelligence (BI) is a set of tools and techniques that process raw data into meaningful information and useful statistics that are used in business analysis, which can help in achieving beneficial results.
Here I need to mention a very useful BI tool that helped me a lot in successfully visualizing my data. Tableau is a very well-known BI tool that creates visualization for data and enables users to communicate with the data to make effective decisions. Have a look at http://www.actiknow.com/tableau-consulting/ to get knowledge about this tool.