


 Your new post is loading...

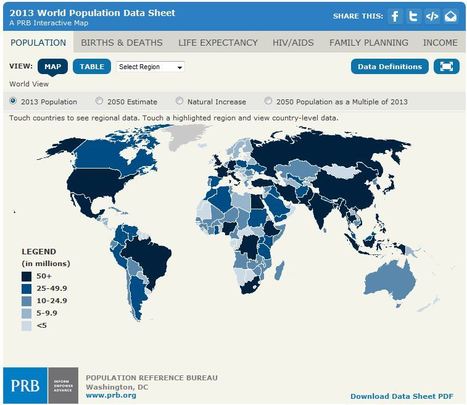

The 2013 World Population Data Sheet lists all geopolitical entities with populations of 150,000 or more and all members of the UN. These include sovereign states, dependencies, overseas departments, and some territories whose status or boundaries may be undetermined or in dispute.
More developed regions, following the UN classification, comprise all of Europe and North America, plus Australia, Japan, and New Zealand.
All other regions and countries are classified as less developed.
The least developed countries consist of 49 countries with especially low incomes, high economic vulnerability, and poor human development indicators; 34 of these countries are in sub-Saharan Africa, 14 in Asia, and one in the Caribbean.
The criteria and list of countries, as defined by the United Nations, can be found at http://www.unohrlls.org/en/ldc/25/.
Click headline to read more--


By looking at this data sheet you can see that the worlds population will increase by the millions in 2050. These populations will increase in areas that are already very populated and in areas that are not so heavily populated yet.
This is an interactive map where you can click the year you wish and see what the population is or will be. it allows a person to observe and understand population growth better.
A straightforward map that puts previous knowledge (of the rapidly growing population and the limited food supply) into prescriptive. -UNIT 2