Digital Collaboration and the 21st C.
14.0K views | +0 today
Follow
Digital Collaboration and the 21st C.
Examines the connectivity possible for global knowledge participative creation and sharing.
Curated by Susan Myburgh
Your new post is loading...
Rescooped by Susan Myburgh from visual data
Scoop.it!

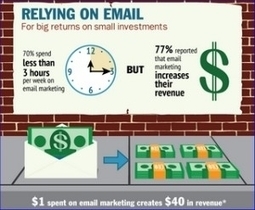
Why Infographics Rule: Marketing & online resources

Why Infographics Rule: Marketing & online resources | Digital Collaboration and the 21st C. | Scoop.it

Humans are visual creatures.

Most of us process information based on what we see and 65 percent of us are considered visual learners.


Social media has created this intense desire and opportunity to share what we learn. Most of us enjoy sharing ideas, especially when there’s a video or a photograph or drawing.


Sure, we’ll share something that’s written: a blog post or tweet or status update, but how many times have you heard of one of those going viral? Mostly, you hear about funny or compelling photos or videos catching fire.

If you can’t create one of those, then you  may want to look into creating an infographic...


Via Lauren Moss
Lauren Moss's curator insight, January 10, 2013 5:05 AM

Addressing the marketing value of infographics, this narrative shares a first-hand account of experiences with online infographic design tools and resources, and provides a number of various links for further research and exploration...

Pam Ivey's curator insight, January 28, 2013 1:31 AM

All about infographics - they're only going to become more and more popular.

Rescooped by Susan Myburgh from Collaborationweb
Scoop.it!

The top 20 data visualisation tools

The top 20 data visualisation tools | Digital Collaboration and the 21st C. | Scoop.it

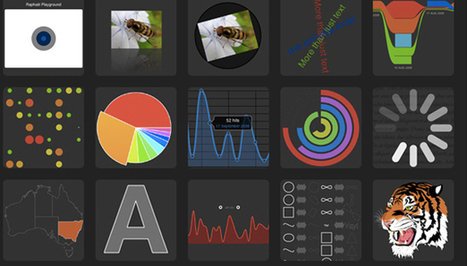
From simple charts to complex maps and infographics, Brian Suda's round-up of the best – and mostly free – tools has everything you need to bring your data to life...

A common question is how to get started with data visualisations. Beyond following blogs, you need to practice – and to practice, you need to understand the tools available. In this article, get introduced to 20 different tools for creating visualisations...


Via Lauren Moss, Baiba Svenca, Content, David Hain
Randy Rebman's curator insight, January 28, 2013 12:33 PM

This looks like it might be a good source for integrating infographics into the classroom.

Rescooped by Susan Myburgh from 21st Century skills of critical and creative thinking
Scoop.it!

All You Need to Know About Infographics: Tips, Tutorials, Guides

All You Need to Know About Infographics: Tips, Tutorials, Guides | Digital Collaboration and the 21st C. | Scoop.it

Let’s be honest, we don’t like to read big pieces of text. Text-heavy graphs are rather difficult for understanding, especially when dealing with numbers and statistics. That is why illustrations and flowcharts are often used for such kind of information.

An infographic, or a visual representation of study or data, like anything else, can be done right or wrong. How to create a successful infographic? A good idea and a good design.


Stop by the link for more on what defines an infographic, what contributes to its popularity, as well as the various types of infographics and references for tutorials and best practices.


Additional topics covered include:

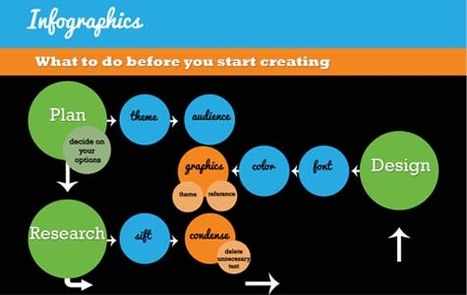
The major parts of an infographic How to create an infographic Developing ideas & organizing data Research & sources Typography, graphics & color Facts & conclusions Designing & Editing


Via Lauren Moss, Monique Walhof, THE OFFICIAL ANDREASCY, Jimi Paradise, Alazne González, Rui Guimarães Lima, Lynnette Van Dyke
HCL's curator insight, April 30, 2014 9:26 PM

Some good tips here...