Digital Collaboration and the 21st C.
14.0K views | +0 today
Follow
Digital Collaboration and the 21st C.
Examines the connectivity possible for global knowledge participative creation and sharing.
Curated by Susan Myburgh
Your new post is loading...
Rescooped by Susan Myburgh from iPads, MakerEd and More in Education
Scoop.it!

A Two-Minute Guide To Artificial Intelligence - FORBES

A Two-Minute Guide To Artificial Intelligence - FORBES | Digital Collaboration and the 21st C. | Scoop.it
If you keep hearing about artificial intelligence but aren’t quite sure what it means or how it works, you’re not alone. 

There’s been much confusion among the general public about the term, not helped by dramatic news stories about how “AI” will destroy jobs, or companies that overstate their abilities to “use AI.” 

A lot of that confusion comes from the misuse of terms like AI and machine learning. So here’s a short text-and-video guide to explain them:  

Via John Evans
No comment yet.
Rescooped by Susan Myburgh from visual data
Scoop.it!

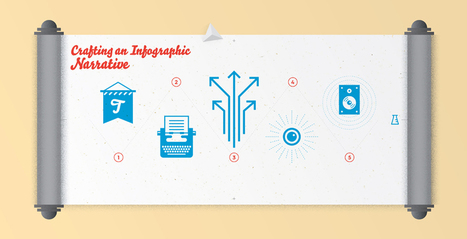
Crafting an Infographic narrative

Crafting an Infographic narrative | Digital Collaboration and the 21st C. | Scoop.it
Crafting an infographic narrative is an art. We detail the five elements of an editorial infographic's narrative and what each element aims to accomplish.

The best infographics are created when a story comes first. In a completed piece, every data point, piece of copy, and design element should support that story. This does not mean, however, that the story an individual or organization wants to tell will intuitively translate to the infographic medium.

Even in instances where all information and data exists on paper, the story may still require adaptation—crafting an infographic narrative to effectively communicate the story. While specific needs vary across applications of infographics, for editorial pieces, this process typically involves writing titles, introductory paragraphs, callouts, and conclusions—the pieces that weave the story together.


Via Lauren Moss
No comment yet.
Rescooped by Susan Myburgh from 21st Century skills of critical and creative thinking
Scoop.it!

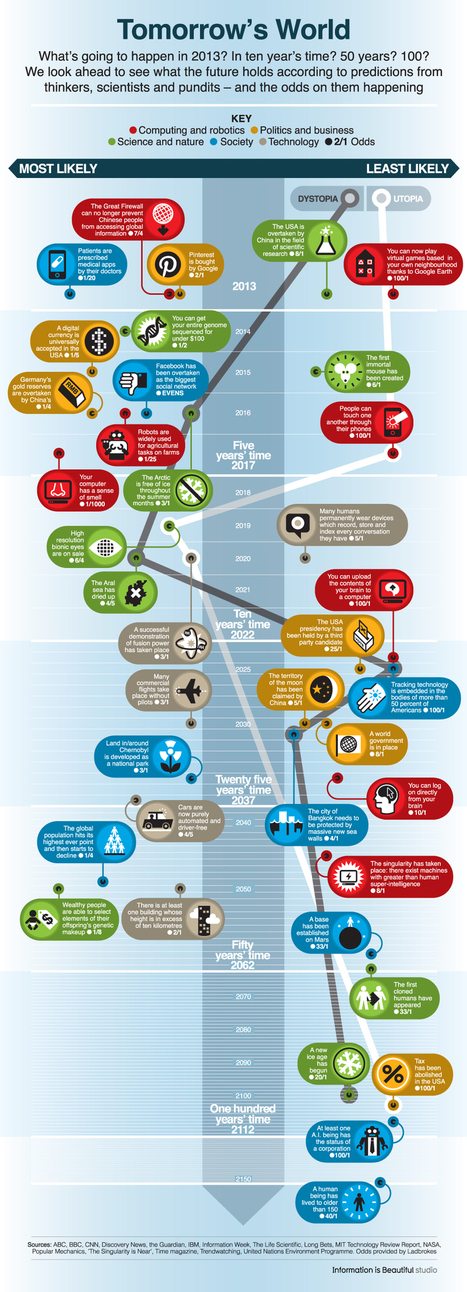
Tomorrow’s world: A visual guide to the next 150 years

Tomorrow’s world: A visual guide to the next 150 years | Digital Collaboration and the 21st C. | Scoop.it

As we begin a new year, BBC Future has compiled 40 intriguing predictions made by scientists, politicians, journalists, bloggers and other assorted pundits in recent years about the shape of the world from 2013 to 2150.


They range from the serious to the fanciful, from the exciting to the petrifying.

And to get a gauge on how likely they are to happen, we asked the special bets department at British betting firm Ladbrokes to give us their odds on each prediction coming true.


[View more at the link]


Via Lauren Moss, Jim Lerman, Lynnette Van Dyke
Alfredo Corell's curator insight, January 8, 2013 6:23 PM

Be prepared for the future...

Anthony Burke's curator insight, January 29, 2013 3:12 AM

How many of these will come true,,,ha...ha I remember some of the great predictions in the past that never made it, whilst the unpredicted did. Anyone remember the "atomic" egg that would fit in a box to power all your household power needs? Anyone remember all the free time we were going to have to manage because robots and AI would be doing all the work?

Guillaume Decugis's comment, January 30, 2013 12:33 AM
And flying cars for the year 2,000? ;-) Great infographic nevertheless. Thanks for sharing!
Rescooped by Susan Myburgh from Content Curation World
Scoop.it!

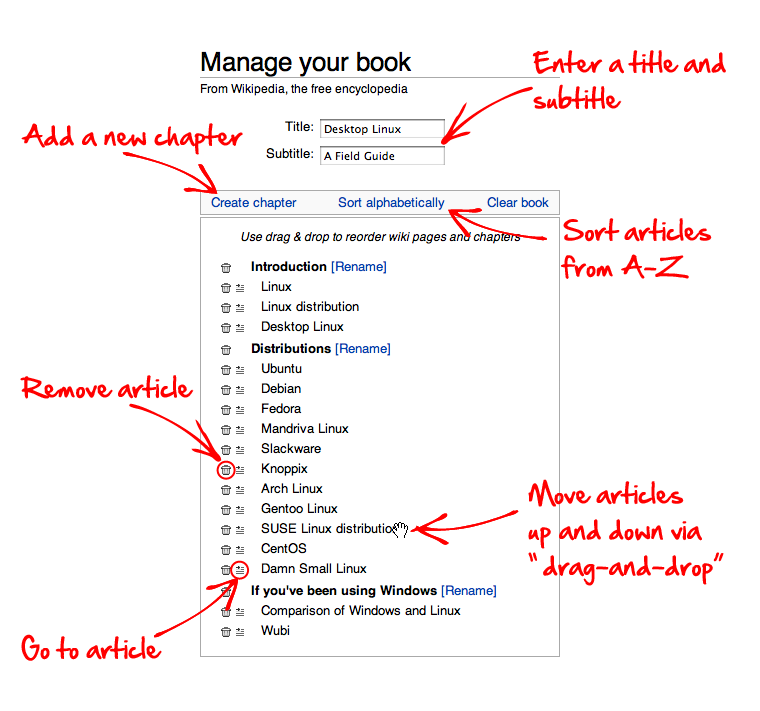
Curate Your Own Wiki-Guide with the Wikipedia Book Create Tool

Help:Books - Wikipedia, the free encyclopedia

There are almost no limits when creating books from Wikipedia content. A good book focuses on a certain topic and covers it as well as possible. A meaningful title helps other users to have the correct expectation regarding the content of a book.


Via Robin Good
'Timothy Leyfer's curator insight, January 24, 2014 12:08 PM

For those of us marketing High value products online this great little tool can help us gather and organize the necessary information we need to help others learn about a specific subject - Chk out what Robin says abou this tool:


"Few people know that it is actually possible to curate Wikipedia content into custom print books or PDF / OpenDocument ebooks that contain exactly the content you want in the order you specify."

(Robin Good)


For thosse of us marketing online this tolol is worth checking out

Tim

Anake Goodall's curator insight, January 24, 2014 5:52 PM

I just love this democratisation of everything; here's self publishing delivered to a keyboard near you courtesy of Wikipedia ...

aufaitLibrarian's curator insight, January 27, 2014 10:04 PM

It's worth keeping in mind that some 'publishers' try to sell books based entirely on Wikipedia content. 

Rescooped by Susan Myburgh from visualizing social media
Scoop.it!

The Social Media Dimensions Blueprint (Infographic)

The Social Media Dimensions Blueprint (Infographic) | Digital Collaboration and the 21st C. | Scoop.it

Like all new technology, social media changes fast.

Just trying to keep your head around all of the different platforms, how to approach them and, of course, how to design for them can be a full time job.

Social media has proven itself as a crucial component of a brand’s marketing mix, but with the many different platforms, it can be very difficult to put forth a consistent brand image online.


The [Ridiculously Exhausitive] Social Media Design Blueprint features all of the major design dimensions for all of the major platforms, including Facebook, Twitter, Google+, LinkedIN, YouTube, Pinterest and the most recent entry, Instagram.


Via Lauren Moss
Two Pens's curator insight, May 30, 2013 1:31 PM

How to keep up with all those pesky design requirements on FB,LI, Twitter, etc. Thank you, somebody!

MESODEV's curator insight, May 31, 2013 4:01 AM

Voilà une infographie utile plutôt que de rechercher sans cesse les bonnes dimensions !

Therese Matthys's curator insight, June 6, 2013 10:05 AM

Is your company consistent with its brand image online across all channels?

Rescooped by Susan Myburgh from 21st Century skills of critical and creative thinking
Scoop.it!

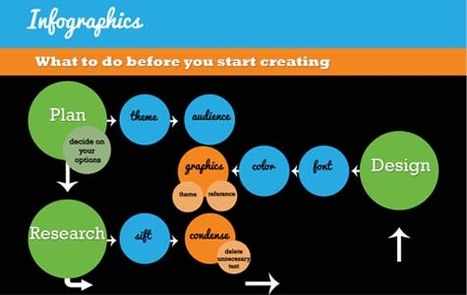
All You Need to Know About Infographics: Tips, Tutorials, Guides

All You Need to Know About Infographics: Tips, Tutorials, Guides | Digital Collaboration and the 21st C. | Scoop.it

Let’s be honest, we don’t like to read big pieces of text. Text-heavy graphs are rather difficult for understanding, especially when dealing with numbers and statistics. That is why illustrations and flowcharts are often used for such kind of information.

An infographic, or a visual representation of study or data, like anything else, can be done right or wrong. How to create a successful infographic? A good idea and a good design.


Stop by the link for more on what defines an infographic, what contributes to its popularity, as well as the various types of infographics and references for tutorials and best practices.


Additional topics covered include:

The major parts of an infographic How to create an infographic Developing ideas & organizing data Research & sources Typography, graphics & color Facts & conclusions Designing & Editing


Via Lauren Moss, Monique Walhof, THE OFFICIAL ANDREASCY, Jimi Paradise, Alazne González, Rui Guimarães Lima, Lynnette Van Dyke
HCL's curator insight, April 30, 2014 9:26 PM

Some good tips here...