

Research and publish the best content.
Get Started for FREE
Sign up with Facebook Sign up with X
I don't have a Facebook or a X account
Already have an account: Login

Didactics and Technology in Education
107.6K views |
+0 today

Almost "everything" about new approaches in Education
Curated by
Rui Guimarães Lima
 Your new post is loading...
 Your new post is loading...
Your new post is loading...
|
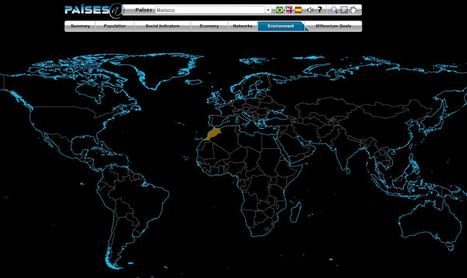
The Brazilian government's geographic department (Instituto Brasileiro de Geografia e Estatística-roughly equivalent to the U.S. Census Bureau) has compiled an fantastic interactive world factbook (available in English and Spanish as well as Portuguese). The ease of navigation allows the user to conduct a specific search of simply explore demographic, economic, environmental and development data on any country in the world.
Via sofilab, pa3geo 
|


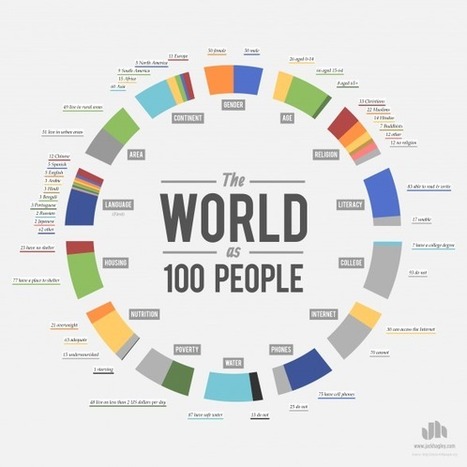
Gr8 Info simplifying stats.
Un conjunto de sencillas infografias para visualizar estadisticas de la humanidad en el tiempo presente
If the World was 100 People shows the statistics of the world as in smaller proportions allowing them to be easily visualized.
Some of the graphics divide the people into regions and nationalities mainly as Formal by continents .