
Learn how to easily create professional-looking infographics in PowerPoint with these 10 free templates.
Via Baiba Svenca
Get Started for FREE
Sign up with Facebook Sign up with X
I don't have a Facebook or a X account


 Your new post is loading...
 Your new post is loading...
Your new post is loading...
Learn how to easily create professional-looking infographics in PowerPoint with these 10 free templates. Via Baiba Svenca 
Data is crucial. However, displaying a chunk of plain data can be monotonous. Infographics visualize plain data and make it visually more appealing. Data turned into infographic has a higher potential to go viral and be effective. While many of us are designers who can design amazing infographs, Infographic Generators can come in handy to Designers and non-designers alike. They can be a time saving resource. So here is a list of 17 fantastic Infographic Generators I compiled together:... Via Jeff Domansky

Willem Kuypers's curator insight,
March 9, 2015 2:37 AM
J'utilise de plus en plus les info-graphiques. Ce site aide à les créer pour ceux qui sont moins doués en graphisme. 
Fran Bozarth's curator insight,
March 11, 2015 2:31 PM
This could spice up just about any presentation - student or instructor. 
Monica S Mcfeeters's curator insight,
March 20, 2015 11:49 PM
Here are links for to help with creating info-graphs.
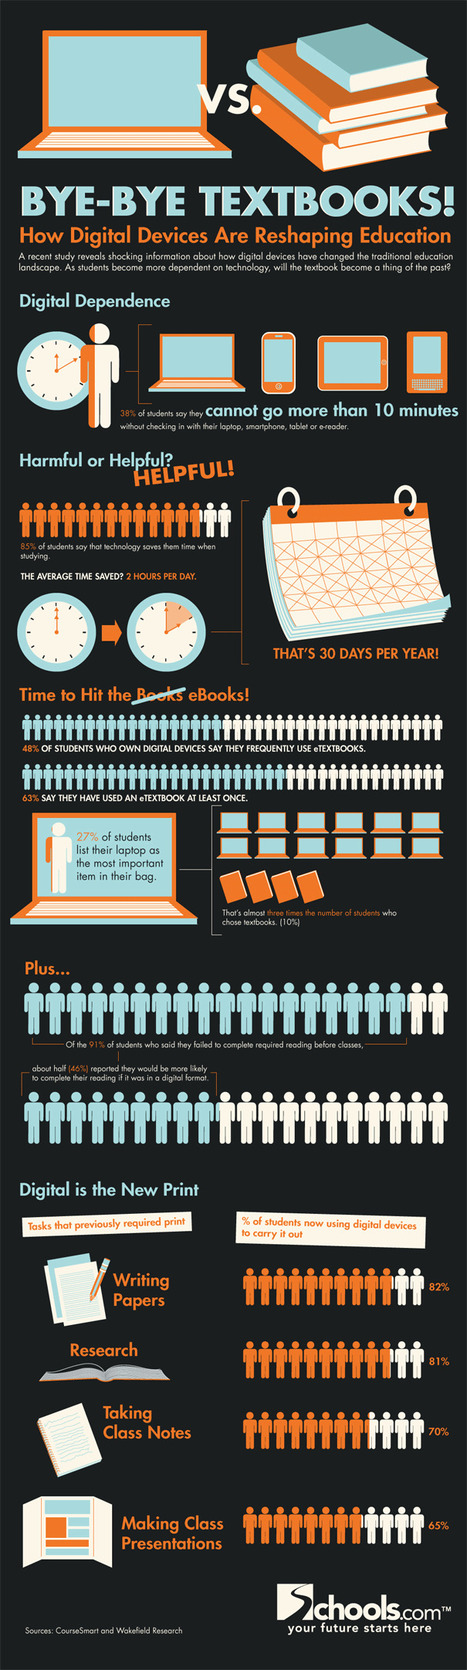
The How Digital Devices Are Reshaping Education Infographic reveals information about how digital devices have changed the traditional education landscape. Via Tom D'Amico (@TDOttawa) , Edith Irizarry

W. Bradley Gooderham's curator insight,
June 20, 2014 11:22 PM
In 2013/14, I only used novels in English class and even then only to provide time away from a screen. Every other class and activity used digital resources and engaged technology to find, sort, contextualize, and share information. This is a very interesting infographic. 
Dyana Mason's curator insight,
June 23, 2014 11:06 PM
Digital devices are re-shaping the classroom. I've seen some new tools in action. As educators, we should learn how students are using these new tools and adjust our teaching appropriately. 
Dian J Harrison, MSW, MPA's curator insight,
July 8, 2014 8:09 PM
This definitely speaks to the support that older students will need to be successful in online programs! For some of these students, the technology learning curve will be steep but doable....... especially if they are used to reading a book in print!

Infographics have already established themselves as engaging news and marketing tools, but they are also entering the education space in new and exciting ways. A good graphic can fit these standards by reinforcing to students that their conclusions should be grounded in evidence and by challenging their ability to organize a hierarchy of systems, a.k.a. the ability to tell what pieces of information are the most important. Via Lauren Moss

Mack James's curator insight,
September 28, 2013 6:15 AM
Infographics is a very interesting way of presenting information. Students can really learn to dig deep into specific information and facts and create infographics to show what they have learned. GREAT!!!!! 
Fàtima Galan's curator insight,
October 2, 2013 9:21 AM
"The goal of the system is to help students distill the most important pieces of information from any given text and form a conclusion."
From
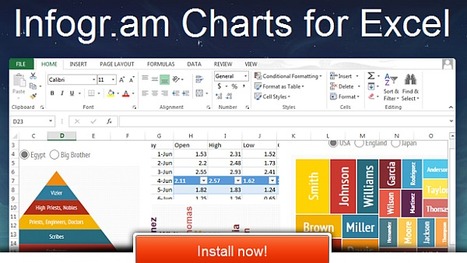
infogr

Create infographics and interactive online charts. It's free and super-easy! Follow other users and discover amazing data stories! Via Baiba Svenca

Victor GraphicSave's comment,
August 3, 2013 9:08 AM
Nice Post Visit My Logo Designs http://graphicsave.com/logo-designs
http://graphicsave.com/restaurant-logo
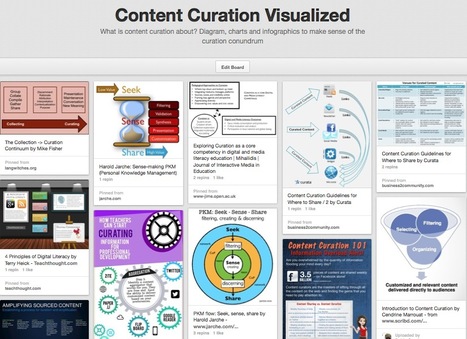
What is content curation about? Diagram, charts and infographics to make sense of the curation conundrum Via Robin Good
Monica S Mcfeeters's curator insight,
March 30, 2014 9:18 AM
This will be helpful to share to those wondering about content curation. 
Jeff Domansky's curator insight,
September 1, 2014 11:53 PM
Valuable collection of the art of curation from Robin Good.
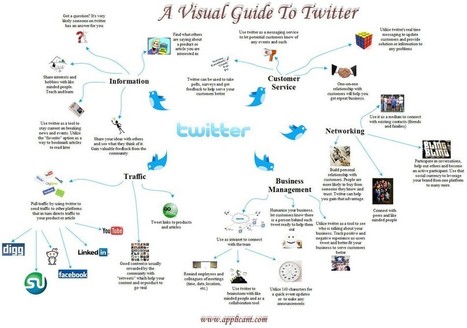
This infographic provides a visual guide and a brief synopsis of different uses for Twitter. It includes information about how Twitter can be used as a tool for information, customer service, networking, business management and website management. Via Lauren Moss, Lynnette Van Dyke, Terheck, John van den Brink, Jesús Hernández
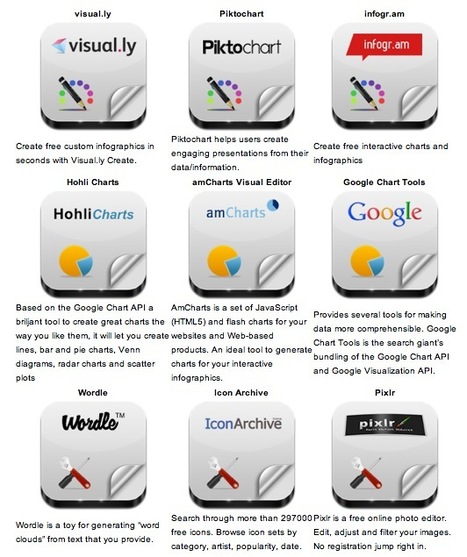
Robin Good: Here is a handy short guide to nine free infographic creation tools that can be utilized to create enticing visuals, word charts and data-based infographics without having special technical skills.
Useful. 8/10
Check them all out: http://www.infographicsarchive.com/create-infographics-and-data-visualization/ ;
(Unearted by Andres Taborga) Via Robin Good

Sahana Chattopadhyay's curator insight,
May 4, 2015 11:59 PM
Infographics are great tools to present curated and focused content from a specific perspective.
![Teacher Salaries: Everything You Wanted To Know [Infographic] | Didactics and Technology in Education | Scoop.it](https://img.scoop.it/4ZUQ_OumRk42TBJ4EXftIjl72eJkfbmt4t8yenImKBVvK0kTmF0xjctABnaLJIm9)
The U.S. Census has shed some light on the current state of teacher salaries and what the rest of the education industry is making every month. Via Gust MEES
Rui Guimarães Lima's insight:
Dados: The U.S. Census (2011)
![Smartphone and Mobile App Usage [Infographic] | Didactics and Technology in Education | Scoop.it](https://img.scoop.it/Lbqdh59xpIMVchKdJRHwkDl72eJkfbmt4t8yenImKBVvK0kTmF0xjctABnaLJIm9)
The Smartphone App Usage showcases the smartphone user behavior. This infographic will also take you through the world of mobile applications and provide you with rich insights and statistics on the popular app categories and mobile games. Via Gust MEES, juandoming

Jacqui Sharp's curator insight,
March 15, 2013 4:30 PM
Clear, well laid out infographic with statistics and recognisable graphics and icons. Lots of great information. Would cause a lot of discussion in a classroom. 
James J. Goldsmith's comment,
March 18, 2013 7:17 PM
Does what a good infographic should do - provides a lot of useful information in an aesthetically pleasing way that can be quickly understood.

AlGonzalezinfo's curator insight,
March 10, 2013 9:05 AM
G+ is catching up big time for many reasons. Among these reasons is the Hangout integration.
We just facilitated a remote 1.5 day leadership development session with Hangouts and it was fantastic.
Google is sticking to their strategy and their value is starting to win people over. I was never a fan and, through valuable features, I am changing my perspective on the suite of offerings.
This is a relevant infographic.
![How Teachers Can Start Curating Information for Professional Development [Infographic] | Didactics and Technology in Education | Scoop.it](https://img.scoop.it/x2S7m-nvkwhh2bn1YCFA0jl72eJkfbmt4t8yenImKBVvK0kTmF0xjctABnaLJIm9)
In Professional Learning in the Digital Age: The Educator's Guide to User-Generated Learning, Kristen Swanson shows educators how to enhance their pro... Via Gust MEES

Louise Robinson-Lay's curator insight,
March 2, 2013 10:56 PM
Handy infographic outlining ways to use the web as a PD tool. |
![How to Create an Infographic in Under an Hour [+10 Free Templates] | Didactics and Technology in Education | Scoop.it](https://img.scoop.it/jKldflV4zNqvqJirZoFfwTl72eJkfbmt4t8yenImKBVvK0kTmF0xjctABnaLJIm9)
Wouldn't it be great if creating infographics was just as simple as writing regular ole text-based blog posts? Unfortunately, the reality is that making visual content like this usually takes a lot more time, effort, and let's face it -- skill -- than the written word. Usually.But considering the popularity and effectiveness of visual content in marketing today, you can't just afford to throw in the towel. That's why we decided to take all the pain and suffering out of infographic creation. Seriously -- don't throw in the towel just yet. You, too, can create professional-looking, high-quality infographics ... quickly! And I'm going to prove it. First things first ... Via Jeff Domansky

Carmen Ramos's curator insight,
April 12, 2015 12:36 PM
Infographiken erstellen einfach gemacht, mit Power Point 
Lori Wilk's curator insight,
April 14, 2015 10:04 AM
It's great to have tools to make your more #effective and #efficient that allows you to improve your #productivity. Execellent to help us to learn about creating #infographics

Mery Elvis Mt's curator insight,
October 7, 2015 8:34 PM
Crear infografías genera un alto engagement, aprende como hacerlas en menos de 1 hora
![How To Find Openly Licensed Educational Resources You Can Use [Infographic] | Didactics and Technology in Education | Scoop.it](https://img.scoop.it/UEhtZjmMpwB5jMfdGK4baTl72eJkfbmt4t8yenImKBVvK0kTmF0xjctABnaLJIm9)
Most of us turn to the internet when we are looking for resources to use for a presentation, report or article. The internet holds the key to so many robust resources. Via juandoming

Suzanne's curator insight,
February 17, 2015 5:02 AM
Every language teacher and student should contribute to make this a powerful resource concept. Language is an instrument; use it, take care of it, share it. 
Dean Mantz's curator insight,
February 18, 2015 11:15 AM
Thanks to @Dennis T OConnor for sharing this infographic on finding and identifying open source education resources. 
Iolanda Bueno de Camargo Cortelazzo's curator insight,
February 19, 2015 12:00 PM
Bastante úteis estas informações para professores e gestores educacionais.

J. Mark Schwanz's curator insight,
July 1, 2014 10:47 AM

Terry Doherty's curator insight,
July 1, 2014 12:44 PM
The bottom line is that U of F wants you to think about being a music educator. I really focused on the research about how music helps with language skills.
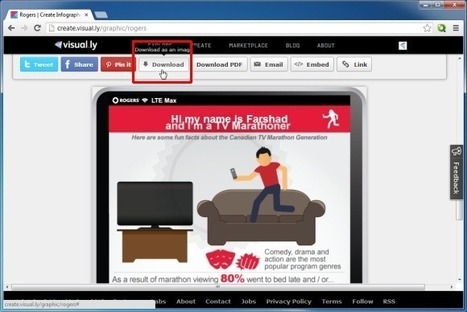
Below are a few web services that you can use to create infographics, which can later be added to PowerPoint presentations and also shared online. Via FPPT, Tatiana Kuzmina

FPPT's curator insight,
August 15, 2013 4:45 PM
Great tools to make awesome infographics for your PowerPoint presentations 
Maria Del Carmen Téllez's curator insight,
August 16, 2013 4:18 PM
Servicios web para crear infografías que después puedes agregar a tus presentaciones PowerPoint y compartirlas online. 
Daniel Jimenez Zulic's curator insight,
August 17, 2013 9:25 AM
El impacto visual de una infografía puede ser mucho mas util que una lista de datos, que terminan agotando al auditor

Vizalizer simplifies the creation, analysis and generation of data visualization through a Social Network that brings together publishers with colleagues and readers, to create content for its analysis and discussion, use in presentations, publications... Via Baiba Svenca

Baiba Svenca's curator insight,
July 9, 2013 3:01 PM
Vizalizer is an interesting tool that lets you create infographics and data visualizations. In my opinion, it is more suitable for business but ingenious people may find how to use it in education as well. The basic version is free but it has limitations.
What is content curation about? Diagram, charts and infographics to make sense of the curation conundrum Via Robin Good
Monica S Mcfeeters's curator insight,
March 30, 2014 9:18 AM
This will be helpful to share to those wondering about content curation.
Jeff Domansky's curator insight,
September 1, 2014 11:53 PM
Valuable collection of the art of curation from Robin Good.
Infographics are interesting–a mash of (hopefully) easily-consumed visuals (so, symbols, shapes, and images) and added relevant character-based data (so, numbers, words, and brief sentences). The learning application for them is clear, with many academic standards–including the Common Core standards–requiring teachers to use a variety of media forms, charts, and other data for both information reading as well as general fluency... Via Baiba Svenca, pa3geo

maite collados's curator insight,
January 14, 2014 11:24 AM
Las infografías son una herramienta muy útil por su factor visual: en poco espacio y de forma visulamente agradable y atrayente, engloba datos y relaciona conceptos. 
ManufacturingStories's curator insight,
July 30, 2014 7:50 AM
For more resources on Social Media & Content Curation visit http://bit.ly/1640Tbl
![Blended Learning & The Teaching Profession [Infographic] | Didactics and Technology in Education | Scoop.it](https://img.scoop.it/2dSgj5Y9sxVZrksq_Oe3NDl72eJkfbmt4t8yenImKBVvK0kTmF0xjctABnaLJIm9)
Just in time to bust a myth that reared its ugly head in the closing keynoteat the ASU/GSV Summit, Digital Learning Now! today released the "Blended Learning & The Teaching Profession." Via Gust MEES

AnnC's curator insight,
April 21, 2013 11:55 AM
Improve conditions for teachers and students with better tools.
Infographics have become very famous the past years, and there have been have been numerous examples and posts showcasing inspiring and creative infographics related to certain topics across the internet.
This particular collection of designs includes 10 infographics that are not all focused on a specific niche subject, though they can all serve as examples of creative visualizations and innovative ways to convey information. Hopefully they will help inform or provide inspiration for any potential new and developing data visualization projects you may be working on... Via Lauren Moss, luiy
![5 Reasons We Use Social Media [Infographic] | Didactics and Technology in Education | Scoop.it](https://img.scoop.it/0dX8Ctv2ZvgMgSGXFog8zzl72eJkfbmt4t8yenImKBVvK0kTmF0xjctABnaLJIm9)
There are many reasons we use social media. From the basic to the more advanced, the tool is simply ubiquitous and addictive. This infographic sheds some light for us all. Via Gust MEES, ABroaderView

Latisha Poulard's curator insight,
March 21, 2013 10:46 PM
You see why if you don't have an online presence then you are part of a dying breed...
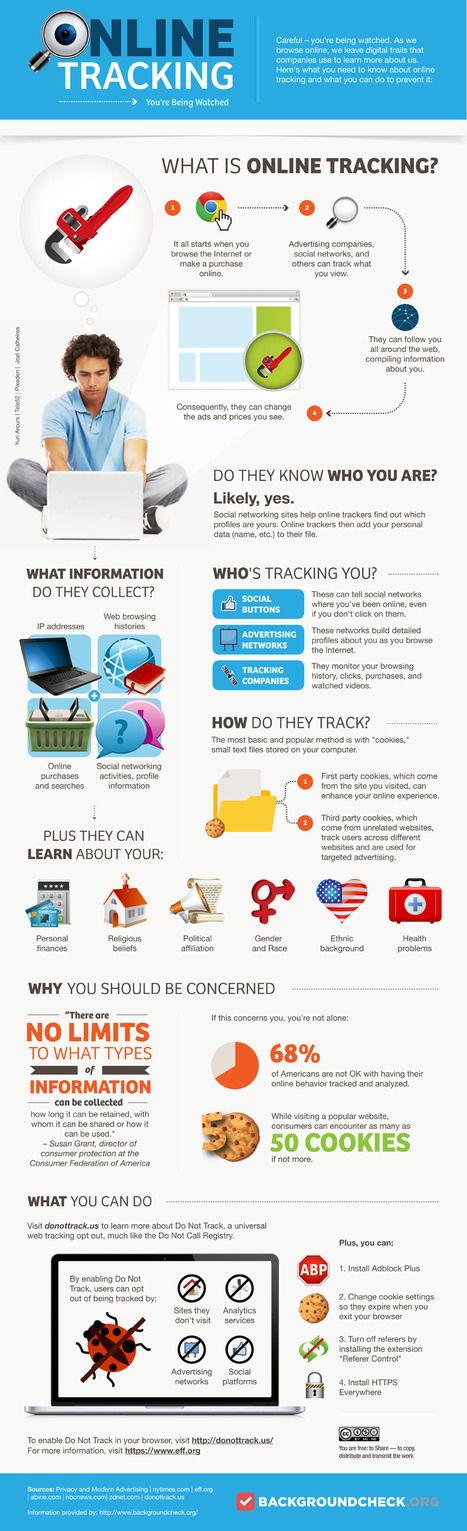
With social buttons, cookies, and watching our online purchases, advertisers are compiling a lot more information about you than you think. Via Gust MEES

Gust MEES's curator insight,
March 5, 2013 6:25 AM
Privacy at danger!!! Check also:
- http://www.scoop.it/t/21st-century-learning-and-teaching?tag=Privacy
- http://www.scoop.it/t/securite-pc-et-internet?tag=Privacy
Gust MEES's curator insight,
March 5, 2013 6:28 AM
Privacy at danger!!! Check also:
- http://www.scoop.it/t/21st-century-learning-and-teaching?tag=Privacy
- http://www.scoop.it/t/securite-pc-et-internet?tag=Privacy
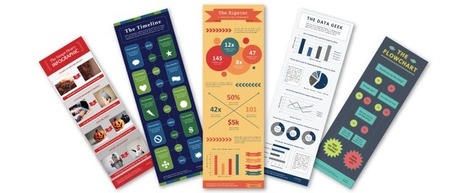
![5 Infographics to Teach You How to Easily Create Infographics in PowerPoint [+ TEMPLATES] | Didactics and Technology in Education | Scoop.it](https://img.scoop.it/AkA24yWmMuLISi2gF1mpLjl72eJkfbmt4t8yenImKBVvK0kTmF0xjctABnaLJIm9)
5 infographics and free templates that will teach you how to easily create professional-looking infographics in PowerPoint. Via massimo facchinetti

gareth jax's curator insight,
March 8, 2013 8:32 AM
Interessante, da approfondire! Non pensavo che powerpoint potesse servire allo scopo... |


![Workplace Personality Types & How They Support Each Other [Infographic] | Didactics and Technology in Education | Scoop.it](https://img.scoop.it/eCgfIu5YbqpKIIcUjn3FdTl72eJkfbmt4t8yenImKBVvK0kTmF0xjctABnaLJIm9)


![20 Reasons Why you Should Use Google Plus [Infographic] | Didactics and Technology in Education | Scoop.it](https://img.scoop.it/j1fJ08aqSCOFcw0g2J6fxjl72eJkfbmt4t8yenImKBVvK0kTmF0xjctABnaLJIm9)


![A Wonderful Graphic Featuring The Importance of Music in Education [Infographic] | Didactics and Technology in Education | Scoop.it](https://img.scoop.it/kGy4ietjhK3B43e3oGDR5Tl72eJkfbmt4t8yenImKBVvK0kTmF0xjctABnaLJIm9)


I love infographics! Thanks to HubSpot for sharing these.
a good visual tool
This is a helpful post for those who would like to make infographics in Powerpoint. You can also download 10 free templates.