Devops for Growth
107.5K views | +0 today
Follow
Devops for Growth
For Product Owners/Product Managers and Scrum Teams: Growth Hacking, Devops, Agile, Lean for IT, Lean Startup, customer centric, software quality...
Curated by Mickael Ruau
Your new post is loading...

Popular Tags

Current selected tag: 'golden signals'. Clear
Scooped by Mickael Ruau
Scoop.it!

How to Monitoring the SRE Golden Signals (E-Book)

Guide to actually monitoring the SRE Golden Signals, which everyone talks about, but never tells you how to do.
No comment yet.
Scooped by Mickael Ruau
Scoop.it!

The 4 Golden Signals + 1 - Back 2 Code

The term 4 golden signals has been introduced by Google SRE team in the book Site Reliability Engineering1. The main definitions presented below are borrowed from this book.

The four golden signals of monitoring are latency, traffic, errors, and saturation. If you can only measure four metrics of your user-facing system, focus on these four.

Mickael Ruau's insight:

The additional mandatory metrics is availability. Everyone will always inquire about availability. Availability can be computed in various ways from incidents duration to formulas built from other metrics. My advice is to track it through dedicated availability tests. Availability tests are a kind of smoke tests from a simple test (perform a connection to a database) to more complex tests involving several operations performed in black-box mode (Testing externally visible behaviour as a user would see it). Start simple and improve it them each time the test is not representative of the availability. In this case the availability is expressed as a percentage of time when the service is available (when the test is OK) over the total time of the measure. It’s also possible to measure a degraded availability when the test ends in WARNING–for example when the result is OK but late. There is always a lot of discussions around availability mainly concerning the downtime for maintenance or when the team is out of office. This topic deserve a dedicated article.

No comment yet.
Scooped by Mickael Ruau
Scoop.it!

How to monitor Golden signals in Kubernetes.

How to monitor Golden signals in Kubernetes. | Devops for Growth | Scoop.it
How to monitor Golden signals in Kubernetes. Golden signals are a set of values that provide a detection method for issues in an application.
No comment yet.
Scooped by Mickael Ruau
Scoop.it!

The 4 Golden Signals of API Health and Performance in Cloud-Native Applications

Modern cloud applications are highly services-driven and leverage a lot of APIs including external APIs such as Twitter Auth API, Twilio API, Google Maps API, and various PaaS APIs. In a previous blog post, we had talked about the shift from monolithic architectures to microservices and the implications of that change from an operational perspective for Site Reliability Engineers (SREs) and DevOps engineers.

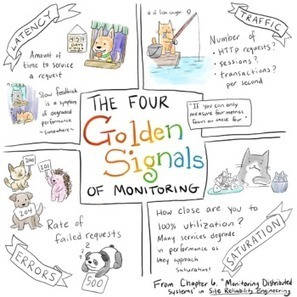
In this blog post, we focus on the golden signals of monitoring that are the foundation of service-level observability for large-scale production applications. These golden signals ultimately help measure end-user experience, service abandonment and impact on business. After discussing these signals, we describe how we have approached their measurement in a way that is fundamentally different from the existing approaches that primarily require code-embedded agents or instrumentation of code.

No comment yet.
Scooped by Mickael Ruau
Scoop.it!

How to Monitor the SRE Golden Signals - Faun

Site Reliability Engineering (SRE) is very popular lately, including the “Golden Signals” that you should be monitoring, but HOW do you actually get these data? This is a guide.
Mickael Ruau's insight:

There are three common lists or methodologies:

  • From the Google SRE book: Latency, Traffic, Errors, and Saturation
  • USE Method (from Brendan Gregg): Utilization, Saturation, and Errors
  • RED Method (from Tom Wilkie): Rate, Errors, and Duration

You can see the overlap, and as Baron Schwartz notes in his Monitoring & Observability with USE and RED blog, each method varies in focus. He suggests USE is about resources with an internal view, while RED is about requests, real work, and thus an external view (from the service consumer’s point of view). They are obviously related, and also complementary, as every service consumes resources to do work.

For our purposes, we’ll focus on a simple superset of five signals:

  • Rate — Request rate, in requests/sec
  • Errors — Error rate, in errors/sec
  • Latency — Response time, including queue/wait time, in milliseconds.
  • Saturation — How overloaded something is, which is related to utilization but more directly measured by things like queue depth (or sometimes concurrency). As a queue measurement, this becomes non-zero when you are saturated, often not much before. Usually a counter.
  • Utilization — How busy the resource or system is. Usually expressed 0–100% and most useful for predictions (as Saturation is probably more useful). Note we are not using the Utilization Law to get this (~Rate x Service Time / Workers), but instead looking for more familiar direct measurements.
No comment yet.
Scooped by Mickael Ruau
Scoop.it!

System Monitoring in the Age of Site Reliability Engineering | ASPE

System Monitoring in the Age of Site Reliability Engineering | ASPE | Devops for Growth | Scoop.it
What makes for good monitoring? What makes for bad monitoring? And how can we tell the difference? Let’s review some of the basic concepts of system monitoring in the age of site reliability engineering.
No comment yet.