Devops for Growth
107.5K views | +8 today
Follow
Devops for Growth
For Product Owners/Product Managers and Scrum Teams: Growth Hacking, Devops, Agile, Lean for IT, Lean Startup, customer centric, software quality...
Curated by Mickael Ruau
Your new post is loading...

Popular Tags

Current selected tag: 'RED - Rate Erros & Duration'. Clear
Scooped by Mickael Ruau
Scoop.it!

How to Monitor the SRE Golden Signals - Faun

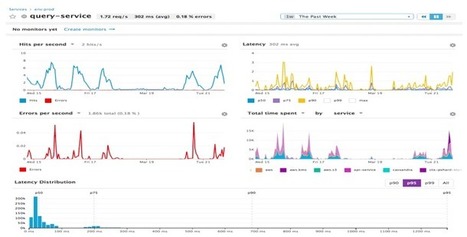
Site Reliability Engineering (SRE) is very popular lately, including the “Golden Signals” that you should be monitoring, but HOW do you actually get these data? This is a guide.
Mickael Ruau's insight:

There are three common lists or methodologies:

  • From the Google SRE book: Latency, Traffic, Errors, and Saturation
  • USE Method (from Brendan Gregg): Utilization, Saturation, and Errors
  • RED Method (from Tom Wilkie): Rate, Errors, and Duration

You can see the overlap, and as Baron Schwartz notes in his Monitoring & Observability with USE and RED blog, each method varies in focus. He suggests USE is about resources with an internal view, while RED is about requests, real work, and thus an external view (from the service consumer’s point of view). They are obviously related, and also complementary, as every service consumes resources to do work.

For our purposes, we’ll focus on a simple superset of five signals:

  • Rate — Request rate, in requests/sec
  • Errors — Error rate, in errors/sec
  • Latency — Response time, including queue/wait time, in milliseconds.
  • Saturation — How overloaded something is, which is related to utilization but more directly measured by things like queue depth (or sometimes concurrency). As a queue measurement, this becomes non-zero when you are saturated, often not much before. Usually a counter.
  • Utilization — How busy the resource or system is. Usually expressed 0–100% and most useful for predictions (as Saturation is probably more useful). Note we are not using the Utilization Law to get this (~Rate x Service Time / Workers), but instead looking for more familiar direct measurements.
No comment yet.
Scooped by Mickael Ruau
Scoop.it!

Monitoring SRE's Golden Signals

Monitoring SRE's Golden Signals | Devops for Growth | Scoop.it
Golden signals are increasingly popular these days due to the rise of SRE. This article outlines what golden signals are, and how to monitor and use them in the context of various common services.
Mickael Ruau's insight:

There is no definitive agreement, but these are the three main lists of golden signals today:

  • From the Google SRE book: Latency, Traffic, Errors, Saturation
  • USE Method (from Brendan Gregg): Utilization, Saturation, Errors
  • RED Method (from Tom Wilkie): Rate, Errors, and Duration


You can see the overlap. USE is about resources with an internal view, while RED is about requests and real work, with an external view.

In this article we will be focusing on a superset consisting of five signals:

  • Request Rate — request rate, in requests/sec.
  • Error Rate — error rate, in errors/sec.
  • Latency — response time, including queue/wait time, in milliseconds.
  • Saturation — how overloaded something is, directly measured by things like queue depth (or sometimes concurrency). Becomes non-zero when the system gets saturated.
  • Utilization — how busy the resource or system is. Usually expressed 0–100% and most useful for predictions (saturation is usually more useful for alerts).

Saturation & utilization are often the hardest to get, but they are also often the most valuable for hunting down current and future problems.

No comment yet.
Scooped by Mickael Ruau
Scoop.it!

The RED Method: key metrics for microservices architecture

The RED Method: key metrics for microservices architecture | Devops for Growth | Scoop.it
Tom Wilkie shares Weaveworks monitoring philosophy and the three most important metrics to use in your microservices architecture.
Mickael Ruau's insight:

Where does The RED Method come from?

I can’t take any credit for this philosophy, as it is 100% based on what I learned as a Google SRE. Google calls it their “The Four Golden Signals”. The Google SRE book is a great read, and goes into way more depth that I can.

Google include an extra metric, Saturation, over and above the RED method. I don’t include Saturation because, in my opinion, it is a more advanced use case. I think the first three metrics are really the most important, and people remember things in threes… But it you’ve mastered the first three, by all means include Saturation.

The name “The RED Method” started life as a tongue-in-cheek play on Brendan Gregg’s USE Method - another recommended read. The USE Method was being circulated around the office when we started Weave Cloud and were discussing how to monitor it. I felt like I needed a catchy name for the monitoring strategy I was proposing, so The RED Method was born. The USE Method is a fantastic way to think about how to monitor resources; we use it as a framework to monitoring the infrastructure behind Weave Cloud. However, I think the abstraction becomes a little strained when talking about services.

No comment yet.
Scooped by Mickael Ruau
Scoop.it!

The RED Method: A New Approach to Monitoring Microservices

The RED Method: A New Approach to Monitoring Microservices | Devops for Growth | Scoop.it
Monitoring microservices effectively still can be a challenge, as many of the traditional performance monitoring techniques are ill-suited for providing the required granularity of system performance. Now a former Google and Weave engineer has developed an approach, called the RED Method, that seems to be gaining favor with administrators. RED “encourages you to come to …
No comment yet.