


 Your new post is loading...

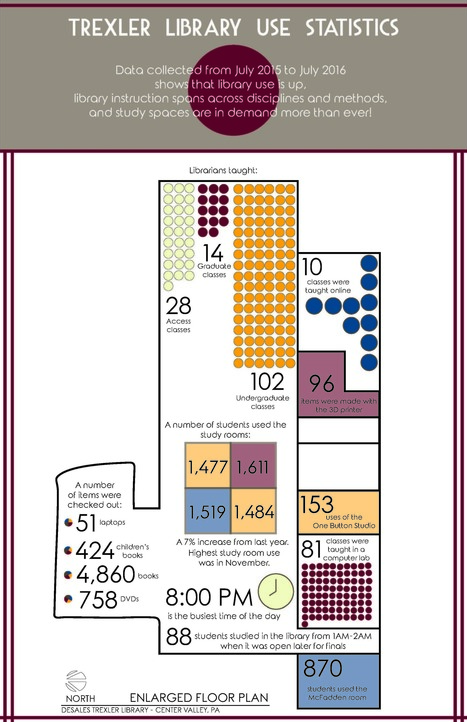

"If you haven't had time to look up from the frenzy, the end of the year is HERE! And with the end of another academic year, often comes the annual gathering of stats. Jess Denke, Public Services Librarian at the Trexler Library at DeSales University, has created an infographic that really illustrates how her library was used."


This is such a great idea! I am seeing more history and science classes this year, so while my circulation numbers are down, the number of students doing research in the library has increased dramatically. If you're not already following, the Librarian Design Share blog is full of great tips!