


 Your new post is loading...


"You don’t need to be a seasoned data scientist or have a degree in graphic design in order to create incredible data visualisations ..."
- Infogr.am
- Fusion Tables
- Piktochart
- dygraphs
- Timeline
- Leaflet
- D3.JS
- Tagxedo
- Easel.ly
- Creately
- Sisense
- Nuvi
- Bime
- Color Brewer
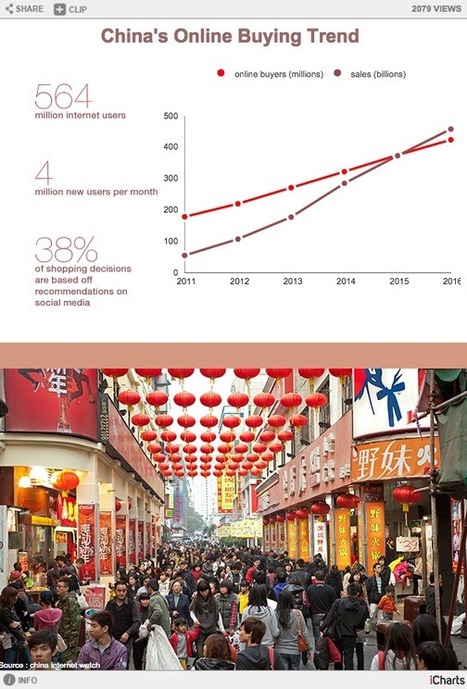
- iCharts
- Better World Flux
- Visual.ly


