Creative teaching and learning
85.3K views | +2 today
Follow
Creative teaching and learning
New spaces for teaching, learning and supervision
Curated by Leona Ungerer
Your new post is loading...
Scooped by Leona Ungerer
Scoop.it!

Seven visualisation tools to make your data beautiful

Seven visualisation tools to make your data beautiful | Creative teaching and learning | Scoop.it

"You don’t need to be a seasoned data scientist or have a degree in graphic design in order to create incredible data visualisations ..."

  • Infogr.am
  • Fusion Tables
  • Piktochart
  • dygraphs
  • Timeline
  • Leaflet
  • D3.JS
  • Tagxedo
  • Easel.ly
  • Creately
  • Sisense
  • Nuvi
  • Bime
  • Color Brewer
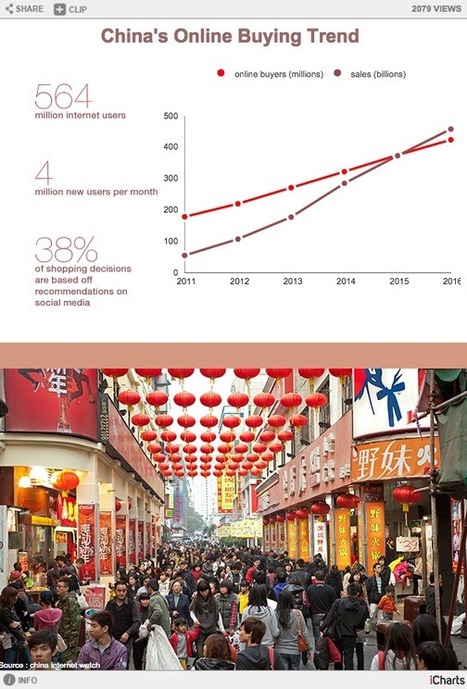
  • iCharts
  • Better World Flux
  • Visual.ly
No comment yet.
Rescooped by Leona Ungerer from Technology to Teach
Scoop.it!

Infographics

Infographics | Creative teaching and learning | Scoop.it

"Infographics are a visual representation of data. When students create infographics, they are using information, visual, and technology literacies. This page includes links to help you develop ..."


Via Amy Burns
Amy Burns's curator insight, November 16, 2014 3:04 PM

Amazing collection of research, resources and examples for inforgraphics.

PitchWorx's comment, November 18, 2014 6:04 AM
Absolutely correct! As we’re an infographic design company, we totally agree with you. Creating Infographic, it helps to communicate effectively with the target audience. They help brands communicate in a more powerful manner!
The Rice Process's curator insight, November 18, 2014 9:40 AM

I find infographics an effective way to present information and data. Because infographics use a combination of images, words, and numbers, it effectively communicates the content both verbally and visually. Learning concepts and relationships can easily be conveyed through a well-designed infographic. Infographics tap the verbal senses through words, phrases, sentences, and captions; and the images and graphic representations bombarded the visual senses. Consequently, infographics present the greatest opportunity to increase the effectiveness of what is being taught.


Designing visual representation of information is more than translating words to pictorials.  The construction involves filtering the information, drawing relationships, revealing patterns and representing the information as meaningful content.