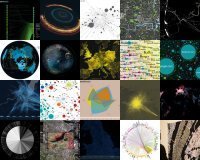
We use a lot of visualisation tools as part of our workflows - ranging from gephi which is interegrated into our analytics tools and workflow engine, d3.js (and a bunch of others) in our web reporting frameworks thoguht to realtime interactive 3D. As a result sites like Visualizing.org a community of creative people making sense of complex issues through data and design are great sources of information, knowledge and inspiration. If you are interested in information presentation and data visualization -its a site worth visting regularly. Click on the image ot title to learn more...


 Your new post is loading...

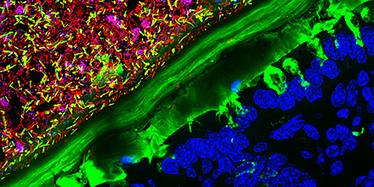


Its a small world - and a stunning photogaph. Examining occurances of microbiota and how they travel between species has a lot of implications for understanding healthcare and disease reservoirs.