


See other data visualization circulating through social media outlets (see the article from City Lab, Atlas Obscura or an urban planning program). New maps use math to define the amorphous term.
Get Started for FREE
Sign up with Facebook Sign up with X
I don't have a Facebook or a X account


 Your new post is loading...
 Your new post is loading...
Your new post is loading...
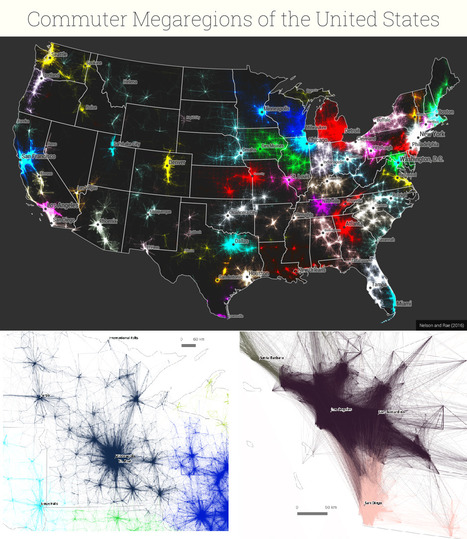
See other data visualization circulating through social media outlets (see the article from City Lab, Atlas Obscura or an urban planning program). New maps use math to define the amorphous term.
PIRatE Lab's insight:
Another example is the long line of defining the new geography.


Boris Limpopo's curator insight,
December 11, 2016 1:43 AM
Le macroregioni americane con i dati del pendolarismo

Tom Cockburn's curator insight,
December 13, 2016 3:53 AM
Plenty of space in the middle it seems
Sign up to comment
|


