Business Improvement and Social media
23.3K views | +0 today
Follow
Your new post is loading...
Rescooped by Ricard Lloria from visualizing social media
Scoop.it!

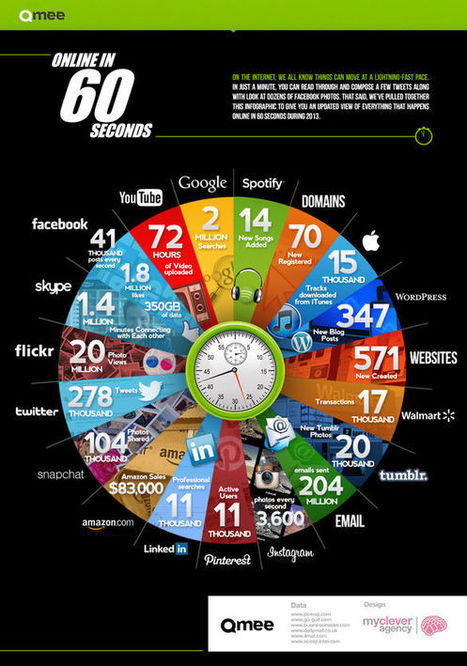
Take A Look At What Happens Every Single Minute On The Internet

Take A Look At What Happens Every Single Minute On The Internet | Business Improvement and Social media | Scoop.it
Early last year we learned that one hour of YouTube is uploaded every second. It was a bracing reminder of just how many people are spending their time online simultaneously.


Created by rewards site Qmee, the infographic "Online In 60 Seconds" is a pie chart that shows off the sheer amount of online activity that takes place every single minute. The amount of YouTube videos uploaded has already increased from January 2012's 60 hours per minute to 72. Additionally, over 1.8 million things are liked on Facebook, and 278 thousand bon mots tweeted. Not depicted in the chart: the amount of work that is going undone while all of these items are being viewed.


Via Lauren Moss
Sois Islam's comment, August 25, 2013 12:39 AM
hello, thnxz for viewing !
Sois Islam's comment, August 25, 2013 12:39 AM
Dear Mr. Mithu thanks for the action.
Angie Thao's curator insight, May 15, 2016 7:06 PM

Single Chart Infograph:

Like: Good visual, good data.

Dislike: Can be a little overwhelming to look at.

Rescooped by Ricard Lloria from visualizing social media
Scoop.it!

How Much do Small Businesses Spend on Social Media?

How Much do Small Businesses Spend on Social Media? | Business Improvement and Social media | Scoop.it

The hype around social media just keeps growing and growing. The problem is that many small businesses jump on the bandwagon without even analyzing whether or not it will be a waste of time for them.


So how much time do small businesses really spend on social media platforms?
This infographic from VerticalResponse attempts to answer that question...


Via Lauren Moss
No comment yet.
Rescooped by Ricard Lloria from visualizing social media
Scoop.it!

How Are We Using Social Media? [INFOGRAPHIC]

How Are We Using Social Media? [INFOGRAPHIC] | Business Improvement and Social media | Scoop.it

Did you know that between 2011 and 2012, time spent on social media increased by some 30 billion minutes, representing a year-on-year increase of 37 percent?

But, according to one study, while Facebook, Twitter and Pinterest remain popular with users aged 30 and over, it’s the formerly niche social platforms such as Reddit, Github and DeviantArt that can boast the highest representation amongst the important 18-29 demographic.


Digital agency iAcquire partnered with SurveyMonkey to track the behaviour of social media users, presenting their key findings in this infographic...


Via Lauren Moss
Bart van Maanen's curator insight, April 5, 2013 6:19 AM

Niet echt verrassend trends, maar goed om even te zien. En gebaseerd op op Amerikaans onderzoek, want ik geloof niet dat Reddit, Github and DeviantArt veel in NL gebruikt worden.