


En la operación de una empresa hay todo tipo de actividades, algunas que agregan valor al producto final, y otras que no. Se calcula que del 15 al 40% de la
Get Started for FREE
Sign up with Facebook Sign up with X
I don't have a Facebook or a X account


 Your new post is loading...
 Your new post is loading...
Your new post is loading...
En la operación de una empresa hay todo tipo de actividades, algunas que agregan valor al producto final, y otras que no. Se calcula que del 15 al 40% de la 
No comment yet.
Sign up to comment
![The Challenge of Getting Visibility on Facebook [infographic] | Business Improvement and Social media | Scoop.it](https://img.scoop.it/FY-KOZwmGranK1azYT-uvjl72eJkfbmt4t8yenImKBVvK0kTmF0xjctABnaLJIm9)
Many face the challenge of getting visibility on Facebook in the newsfeed, especially for business pages. And, maybe that’s why I’m hearing more and more people talking about moving over to Google+. It’s estimated that only about 10% of the people who follow your Facebook page, actually see your content. So you’re left to spend an unreal amount of time posting pictures, videos, polls and links in the hope that your followers will see and engage with your content. Or, you can advertise your content with promoted posts and offers in an attempt to get attention in the newsfeed.
If you’re committed to marketing your business on Facebook (and with over 1 billion users, who isn’t?), the infographic below may help you choose how to engage for the best return on your investment of time. Via Lauren Moss

Mike Gingerich's curator insight,
January 30, 2013 5:18 PM
Images and video are the future, prepare now! |
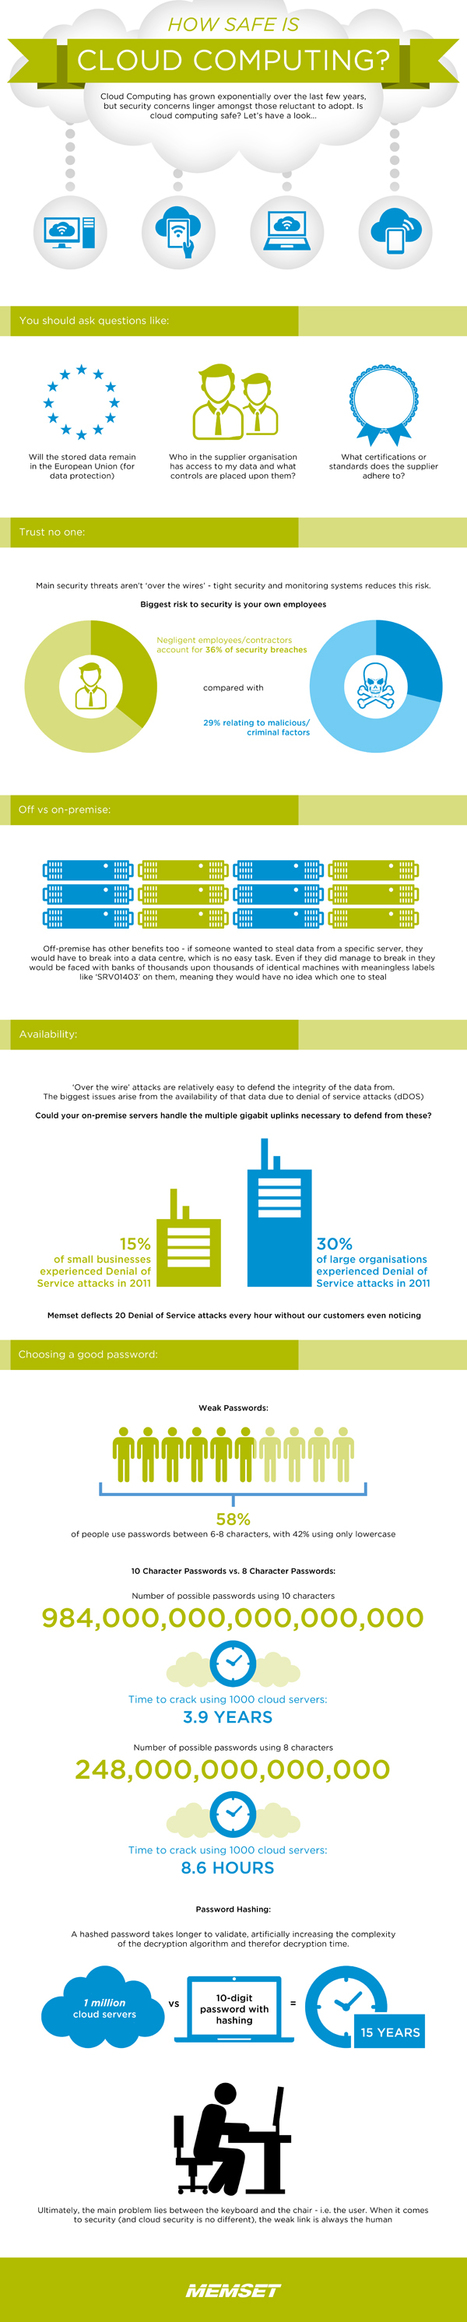
There are benefits in using cloud technologies - cost savings, improved productivity, etc. But - just how safe is the cloud? Via Peter Azzopardi, Brian Yanish - MarketingHits.com, John van den Brink

Mike Ellsworth's curator insight,
February 21, 2013 4:47 PM
Yeah, I've wondered about denial of service attacks and the cloud. Could cost you a bunch if you pay by the cycle . . . 
AlGonzalezinfo's curator insight,
February 22, 2013 6:56 AM
Good information on this graphic, especially about the security threat from employees and contratctors
![What The Social Media Ecosystem Looks Like Right Now [Infographics] | Business Improvement and Social media | Scoop.it](https://img.scoop.it/aeODM-eUZYOY0CoP0nrhLTl72eJkfbmt4t8yenImKBVvK0kTmF0xjctABnaLJIm9)
The social media landscape is anything but constant — it seems like the ecosystem is changing daily... The key question that brands have when planning and then analyzing social media campaigns is how to measure the impact that every dollar spent on paid social media has on the value their owned and earned social media. An additional infographic analyzes the interaction of these three forms of social media, explaining: "The high level analysis for media effectiveness takes all of earned and owned divided by paid. Earned is all the impressions generated divided by average CPM, owned includes all channels, and paid is the overall media spend. The higher the ratio, the more earned amplification is generated from paid." Via Lauren Moss
|


