@Tecnoedumx
316.2K views | +3 today
Follow
@Tecnoedumx
Blog para compartir temas, experiencias y conocimientos que nos harán mejores docentes. Noticias de Tecnología.
Your new post is loading...
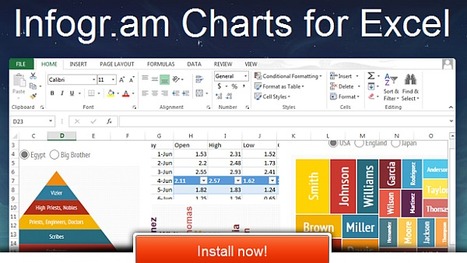
Rescooped by Wilmer Ramírez from Digital Presentations in Education
Scoop.it!

Infogr.am Charts for Excel

Infogr.am Charts for Excel | @Tecnoedumx | Scoop.it
Create infographics and interactive online charts. It's free and super-easy! Follow other users and discover amazing data stories!

Via Baiba Svenca
Ali Anani's curator insight, July 28, 2013 12:45 AM

Make great charts for free

LundTechIntegration's curator insight, July 29, 2013 9:17 AM

I love this. 

Victor GraphicSave's comment, August 3, 2013 9:08 AM
Nice Post Visit My Logo Designs http://graphicsave.com/logo-designs
http://graphicsave.com/restaurant-logo
Rescooped by Wilmer Ramírez from Digital Presentations in Education
Scoop.it!

46 Tools To Make Infographics In The Classroom

46 Tools To Make Infographics In The Classroom | @Tecnoedumx | Scoop.it

Infographics are interesting–a mash of (hopefully) easily-consumed visuals (so, symbols, shapes, and images) and added relevant character-based data (so, numbers, words, and brief sentences).

The learning application for them is clear, with many academic standards–including the Common Core standards–requiring teachers to use a variety of media forms, charts, and other data for both information reading as well as general fluency...


Via Baiba Svenca
maite collados's curator insight, January 14, 2014 11:24 AM

Las infografías son una herramienta muy útil por su factor visual: en poco espacio y de forma visulamente agradable y atrayente, engloba datos y relaciona conceptos.

ManufacturingStories's curator insight, July 30, 2014 7:50 AM

For more resources on Social Media & Content Curation visit http://bit.ly/1640Tbl


Cynthia Day's curator insight, July 30, 2014 2:45 PM

apps

Rescooped by Wilmer Ramírez from Aplicaciones y Herramientas . Software de Diseño
Scoop.it!

Infographic Builders: 9 Free Tools To Create Great Visual Charts

Infographic Builders: 9 Free Tools To Create Great Visual Charts | @Tecnoedumx | Scoop.it

Robin Good: Here is a handy short guide to nine free infographic creation tools that can be utilized to create enticing visuals, word charts and data-based infographics without having special technical skills.


Via Robin Good, evangelina chavez
Trude Burnett's curator insight, May 9, 2014 3:48 PM

Good tools to make Infographics

becool's curator insight, May 4, 2015 6:40 AM

Infographics voor zij die er nog steeds zot van zijn.

Sahana Chattopadhyay's curator insight, May 4, 2015 11:59 PM

Infographics are great tools to present curated and focused content from a specific perspective. 

Rescooped by Wilmer Ramírez from Docentes y TIC (Teachers and ICT)
Scoop.it!

Need To Explain To Others What Content Curation Is? Use This Visual Collection

Need To Explain To Others What Content Curation Is? Use This Visual Collection | @Tecnoedumx | Scoop.it
What is content curation about? Diagram, charts and infographics to make sense of the curation conundrum

Via Robin Good, Ana Rodera
Ali Anani's curator insight, March 4, 2014 12:39 AM

Curate using this visual map

Monica S Mcfeeters's curator insight, March 30, 2014 9:18 AM

This will be helpful to share to those wondering about content curation.

Jeff Domansky's curator insight, September 1, 2014 11:53 PM

Valuable collection of the art of curation from Robin Good.

Rescooped by Wilmer Ramírez from E-Learning-Inclusivo (Mashup)
Scoop.it!

How Do We Measure a Competency?

How Do We Measure a Competency? | @Tecnoedumx | Scoop.it
Recently, I participated in two excellent Twitter chats on the #21stedchat hashtag. The first was about Assessing 21st Century Competencies and the second explored Marks and Grades in the 21st Cent...

Via Gust MEES, juandoming
Gust MEES's curator insight, January 23, 2013 10:26 AM

A MUST read!


Louise Robinson-Lay's curator insight, January 25, 2013 5:27 PM

21 st century learning skills.