Aprendiendo a Distancia
106.0K views | +0 today
Follow
Aprendiendo a Distancia
Colaborando para una mejor educación en línea para adelantar la evolución de la enseñanza y aprendizaje usando la tecnología y pedagogía como estrategias.
Your new post is loading...
Rescooped by Alfredo Calderón from Learning & Mind & Brain
Scoop.it!

Study suggests visuals improve learning - Enhancing learning during lecture note-taking using outlines and illustrative diagrams

Study suggests visuals improve learning  - Enhancing learning during lecture note-taking using outlines and illustrative diagrams | Aprendiendo a Distancia | Scoop.it


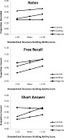
The current study examined the effects of providing learning aids during a lecture on later test performance, and its relationship to structure-building ability. Before taking notes on an audio lecture, participants were either given a skeletal outline, an illustrative diagram, or no learning aid at all. After the lecture, participants were given a free recall test and a short-answer test that probed understanding of target concepts (requiring explanation). For low-ability structure builders, outlines improved free recall but not short-answer performance compared to the no-aid control condition. By contrast, providing high-ability structure builders with outlines improved free recall and short-answer performance (relative to the control). An illustrative diagram improved free recall and short-answer performance compared to the control condition, regardless of structure-building ability. Thus, these aids are generally useful for improving learning while listening to a lecture. Implications for the more specific enhancement patterns for low-ability structure builders are discussed.


Via Rosemary Tyrrell, Ed.D., Miloš Bajčetić
Rosemary Tyrrell, Ed.D.'s curator insight, June 21, 2015 8:29 PM

Interesting study. Worth a read. 

Rescooped by Alfredo Calderón from Digital Presentations in Education
Scoop.it!

yEd - Graph Editor

yEd - Graph Editor | Aprendiendo a Distancia | Scoop.it

yEd is a powerful desktop application that can be used to quickly and effectively generate high-quality diagrams. Create diagrams manually, or import your external data for analysis. Our automatic layout algorithms arrange even large data sets with just the press of a button.


Via Baiba Svenca
Baiba Svenca's curator insight, August 8, 2013 2:28 PM

yED software is free to download, it works on all platforms and helps you create beautiful diagrams using ready-to-use elements. Import your data, including from Excel, and export your diagrams in a wide range of graphics formats.

Karen Lopez's curator insight, August 9, 2013 11:48 AM

Engaging and super fun!

Marie-Chantal SCHMITZ's curator insight, August 27, 2013 9:00 AM

Pour les professeurs ou les élèves qui souhaitent agrémenter leurs documents de graphiques soignés

Rescooped by Alfredo Calderón from Digital Presentations in Education
Scoop.it!

Diagramo - Flowchart software | Diagram software

Diagramo - Flowchart software | Diagram software | Aprendiendo a Distancia | Scoop.it

It's FREE and Open Source (GPL).
It's pure HTML5.
Share and collaborate.
Export to SVG, Gif and JPEG.
Life time support & storage.


Via Baiba Svenca
No comment yet.
Rescooped by Alfredo Calderón from Digital Presentations in Education
Scoop.it!

ChartsBin.com - Visualize your data

ChartsBin.com - Visualize your data | Aprendiendo a Distancia | Scoop.it

ChartsBin is a web-based data visualization tool that will allow everyone to quickly and easily create rich interactive visualizations with their own data...

Download charts from the extensive chart library or create your own.


Via Baiba Svenca
No comment yet.
Rescooped by Alfredo Calderón from Interesting stuff for ESL EFL teachers
Scoop.it!

12 Free Create Charts and Graphs Online Diagrams Tools | Online Free Tools

12 Free Create Charts and Graphs Online Diagrams Tools | Online Free Tools | Aprendiendo a Distancia | Scoop.it
Presenting the data in a visual form is the best and effective way. Create Chart and Graph using Online Diagram creating Tools.

Via Kamran Khan, Renee Maufroid
Kamran Khan's comment, September 9, 2013 8:38 AM
Thanks for Rescooping
Kamran Khan's curator insight, September 11, 2013 1:51 AM
Create Online Charts,Graphs and Diagrams Tools
Rescooped by Alfredo Calderón from Content Curation World
Scoop.it!

Need To Explain To Others What Content Curation Is? Use This Visual Collection

Need To Explain To Others What Content Curation Is? Use This Visual Collection | Aprendiendo a Distancia | Scoop.it
What is content curation about? Diagram, charts and infographics to make sense of the curation conundrum

Via Robin Good
Ali Anani's curator insight, March 4, 2014 12:39 AM

Curate using this visual map

Monica S Mcfeeters's curator insight, March 30, 2014 9:18 AM

This will be helpful to share to those wondering about content curation.

Jeff Domansky's curator insight, September 1, 2014 11:53 PM

Valuable collection of the art of curation from Robin Good.

Rescooped by Alfredo Calderón from Digital Presentations in Education
Scoop.it!

Diagramly - Draw Diagrams Online

Diagramly - Draw Diagrams Online | Aprendiendo a Distancia | Scoop.it

Diagramly is a capable online diagramming tool, it’s free and can produce fairly complex diagrams and charts...


Via Baiba Svenca
Rescooped by Alfredo Calderón from Digital Presentations in Education
Scoop.it!

Lucid Chart: Create Awesome Diagrams And Flowcharts For Presentations

Lucid Chart: Create Awesome Diagrams And Flowcharts For Presentations | Aprendiendo a Distancia | Scoop.it
Lucid Chart is an online platform for creating powerful diagrams and flowcharts that can be used for creating presentations and for visual communication with your audience.
Via Baiba Svenca
No comment yet.