

We use R to take a very brief look at the distribution of e-book sales on Amazon.com.
Get Started for FREE
Sign up with Facebook Sign up with X
I don't have a Facebook or a X account


 Your new post is loading...
 Your new post is loading...
Your new post is loading...
We use R to take a very brief look at the distribution of e-book sales on Amazon.com. 
No comment yet.
Sign up to comment
|


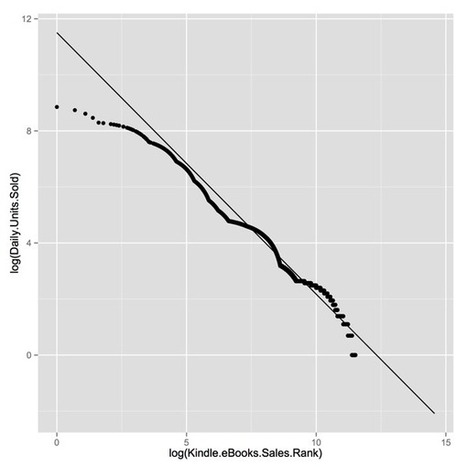
The chart is log-log. It is a plot of daily e-book sales versus Kindle e-book rank for Amazon.com's top 50,000. I don't see much of a tail.