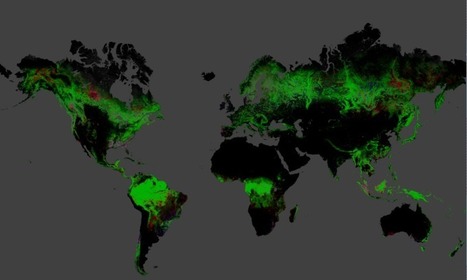
Brazil has managed to cut deforestation in half since 2000. But that's been offset by increasing forest loss in other countries.
Results from time-series analysis of Landsat images characterizing forest extent and change. Trees are defined as vegetation taller than 5m in height and are expressed as a percentage per output grid cell as ‘2000 Percent Tree Cover’.
‘Forest Cover Loss’ is defined as a stand-replacement disturbance, or a change from a forest to non-forest state, during the period 2000–2018. ‘Forest Cover Gain’ is defined as the inverse of loss, or a non-forest to forest change entirely within the period 2000–2012. ‘Forest Loss Year’ is a disaggregation of total ‘Forest Loss’ to annual time scales.
Reference 2000 and 2018 imagery are median observations from a set of quality assessment-passed growing season observations.
You can inspect the maps in closer detail at this site.
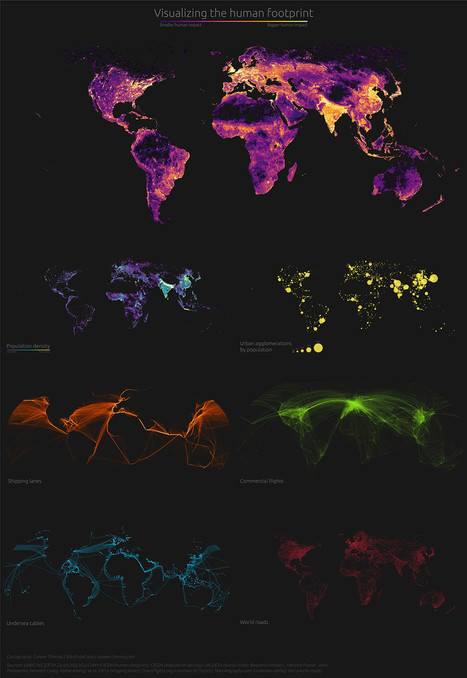
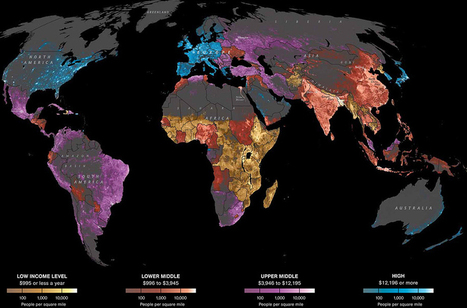
From global shipping to undersea cables and population density, these maps highlight our impact on the planet.
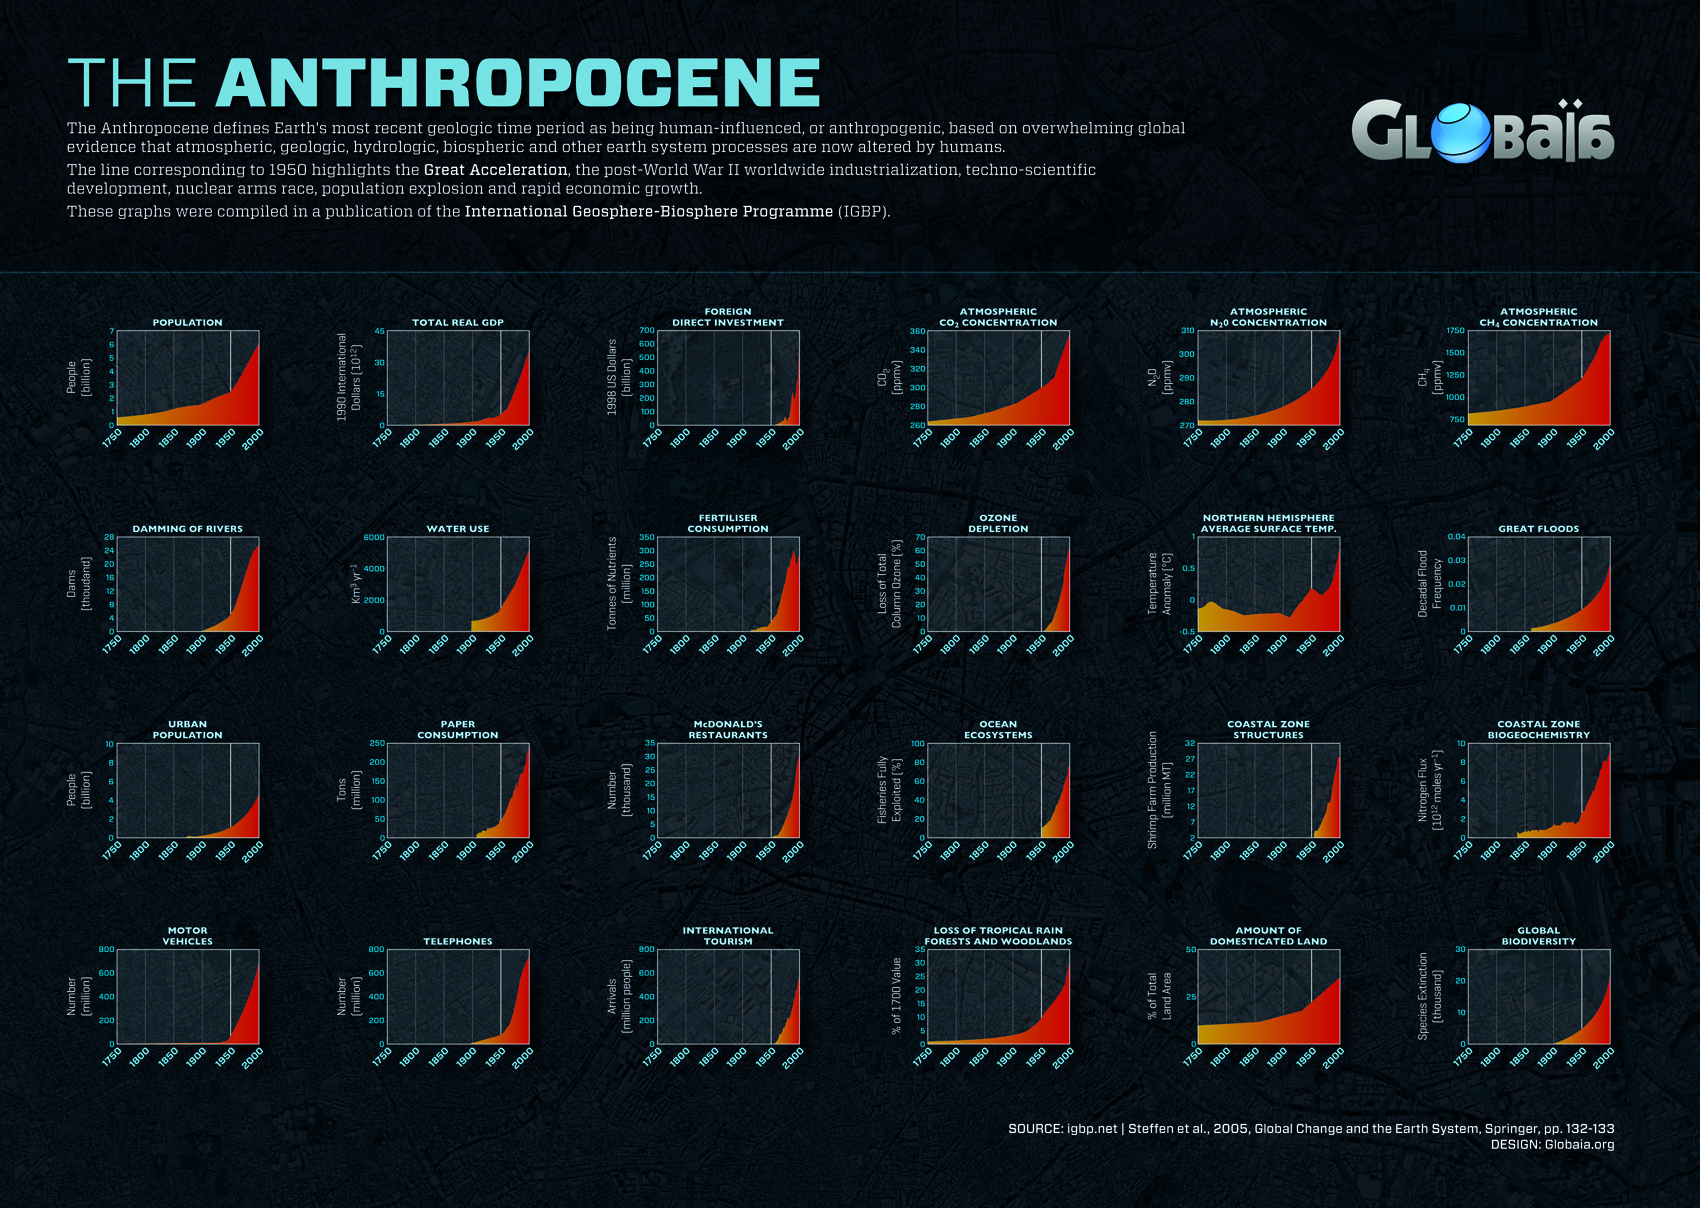
In a short amount of time, humans have changed the face of planet Earth. Our impact has been so profound, in fact, that scientists have declared the dawn of the Anthropocene epoch, or the age of human influence. Today’s ambitious graphic comes to us from Reldresal, and it looks at this human footprint from a number of different angles. Here are some of the ones we found most interesting.
POPULATION DENSITY
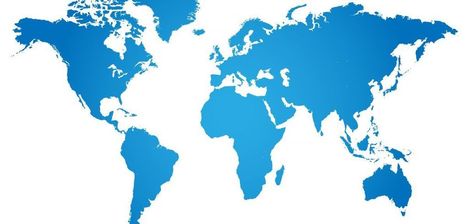
While there are humans present in nearly every part of the world, the overall distribution of population is far from even. As the map above vividly demonstrates, humans cluster in specific places that have the right conditions to support a large population. Massive river deltas such as Ganges-Brahmaputra (Bangladesh) and the Nile (Egypt) are obvious bright spots on the map. Not surprisingly, sparsely populated countries like Australia and Canada are nearly indistinguishable as most people cluster in more habitable places.
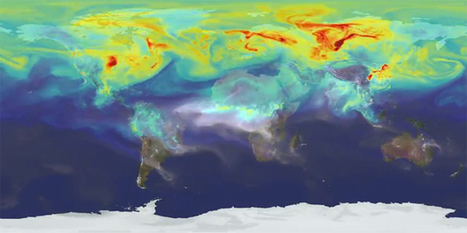
Scientists and politicians all agree – climate change and global warming are not just myths. They are a fact. This compilation of maps will show you what are the reasons behind it and what are the consequences of that process.
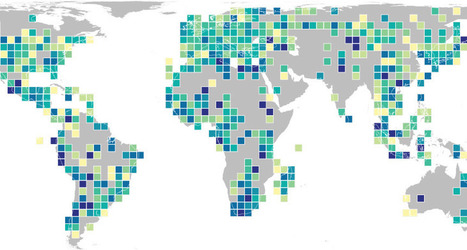
Maps have long been used to show the animal kingdom’srange, regional mix, populations at risk and more. Now a new set of maps reveals the global distribution of genetic diversity.
“Without genetic diversity, species can’t evolve into new species,” says Andreia Miraldo, a population geneticist at the Natural History Museum of Denmark in Copenhagen. “It also plays a fundamental role in allowing species populations to adapt to changes in their environment.”
Miraldo and her colleagues gathered geographical coordinates for more than 92,000 records of mitochondrial DNA from 4,675 species of land mammals and amphibians. The researchers compared changes in cytochrome b, a gene often used to measure genetic diversity within a species, and then mapped the average genetic diversity for all species within roughly 150,000 square-kilometer areas.
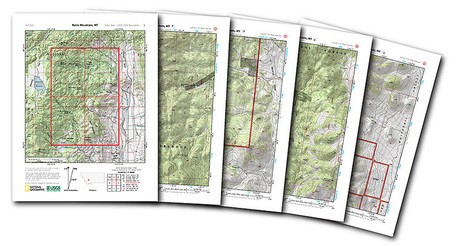
National Geographic just did a solid favor for all the adventurous outdoor photographers out there. They put every US Geological Survey (USGS) topographical map from across the United States on one easy-to-navigate site and made them easy to print out at home.
If you’ve ever gone hunting topo maps via the USGS, you know that it can be a bit of a pain because, not only is finding the quad you’re looking for more difficult, the PDFs they have available aren’t formatted for standard printer paper.
The National Geographic website solves both of these issues. First, the homepage greets you with a searchable, interactive map: all you have to do is search for or zoom in on the area you’re looking for. Then, once you find your quad, just click on it and a printable PDF loads right up.
It’s incredibly easy. I pulled this one up in a matter of seconds.
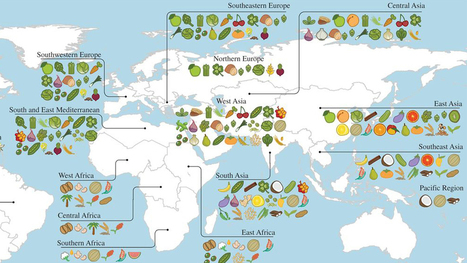
A new study reveals the full extent of globalization in our food supply. More than two-thirds of the crops that underpin national diets originally came from somewhere else — often far away.
Previous work by the same authors had shown that national diets have adopted new crops and become more and more globally alike in recent decades. The new study shows that those crops are mainly foreign.
The idea that crop plants have centers of origin, where they were originally domesticated, goes back to the 1920s and the great Russian plant explorer Nikolai Vavilov. He reasoned that the region where a crop had been domesticated would be marked by the greatest diversity of that crop, because farmers there would have been selecting different types for the longest time. Diversity, along with the presence of that crop's wild relatives, marked the center of origin.
The Fertile Crescent, with its profusion of wild grasses related to wheat and barley, is the primary center of diversity for those cereals. Thai chilies come originally from Central America and tropical South America, while Italian tomatoes come from the Andes.
Khoury and his colleagues extended Vavilov's methods to look for the origins of 151 different crops across 23 geographical regions. They then examined national statistics for diet and food production in 177 countries, covering 98.5 percent of the world's population.
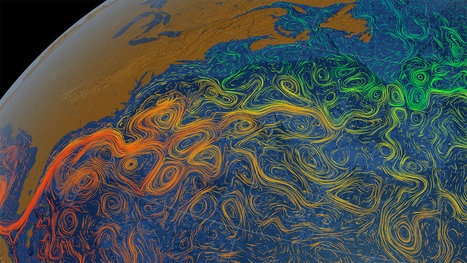
These maps from NASA show ocean currents around the world.
The world's oceans are in constant motion, and this series of maps published by the NASA/Goddard Space Flight Center Scientific Visualization Studio helps provide us with a nice illustration of this movement. The maps, which were created at various times in past years, show the many warm and cold ocean currents responsible for transporting water across long distances throughout the world's oceans.
In addition to the ocean currents, you can also see swirly features, known as ocean eddies, on the maps. An ocean eddy is formed when currents sometimes pinch off into sections, creating the circular current. Sometimes significant eddies are given names, according to NOAA.
Below we have selected a few of the maps from NASA's collection, accompanied by a brief explanation of what you are seeing.
In addition to a large-scale view of ocean circulations and eddies across the world, you can also see water temperatures in this image. The orange and red shadings in the middle of the map correspond to the warmer waters in tropics. Cooler waters depicted in green and blue are located north and south of this as you head towards the poles.
When looking at this map there area few things that stick out to me and not just the colors. Fistly what I founf interesting was that South America in relation to where we live is quite different. For example, The US economic status is High Class at $12195 or more for most of the East and West Coast and then it is dull in the middle. These facts compared to South America where they are mostly upper middle class at around $3946-12185 and a portion of them are the lower middle class which rings in at around $886-3945.
On map 33, it shows the religious borders map of the different religions that are occupying certain areas of the Middle East. The area of Baghdad and east is mostly Shiite Islam and west of Baghdad is Sunni Islam. What I found to be most interesting is that even though Jerusalem is surrounded by many different religions they still celebrate Judaism. They are religiously protected by its borders. There is some sign of Sunni Islam being practices within their borders but it is mostly dominated by Judaism.
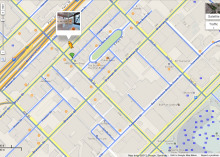
A new feature inside Google Maps lets users peek inside businesses before visiting them, thanks to panoramic photos shared by the businesses with Google.
"These interior business photos on Google Maps give you the feeling of being there, and the comfort of knowing what to expect when you arrive," the company said in a blog post. To see the panoramic photos, first zoom in toward street level -- if you're more than four levels up from the street, it won't work. Click and drag the orange figure known as Pegman over the section of the map you're looking at. Once you do, you'll see orange dots indicating businesses that have submitted panoramas to Google. The company says "thousands" of businesses have submitted photos so far.
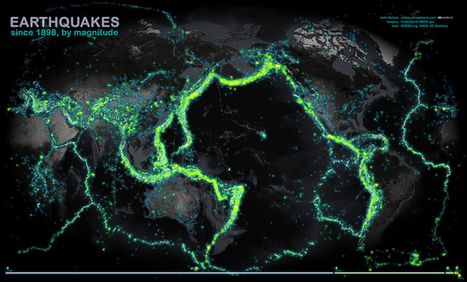
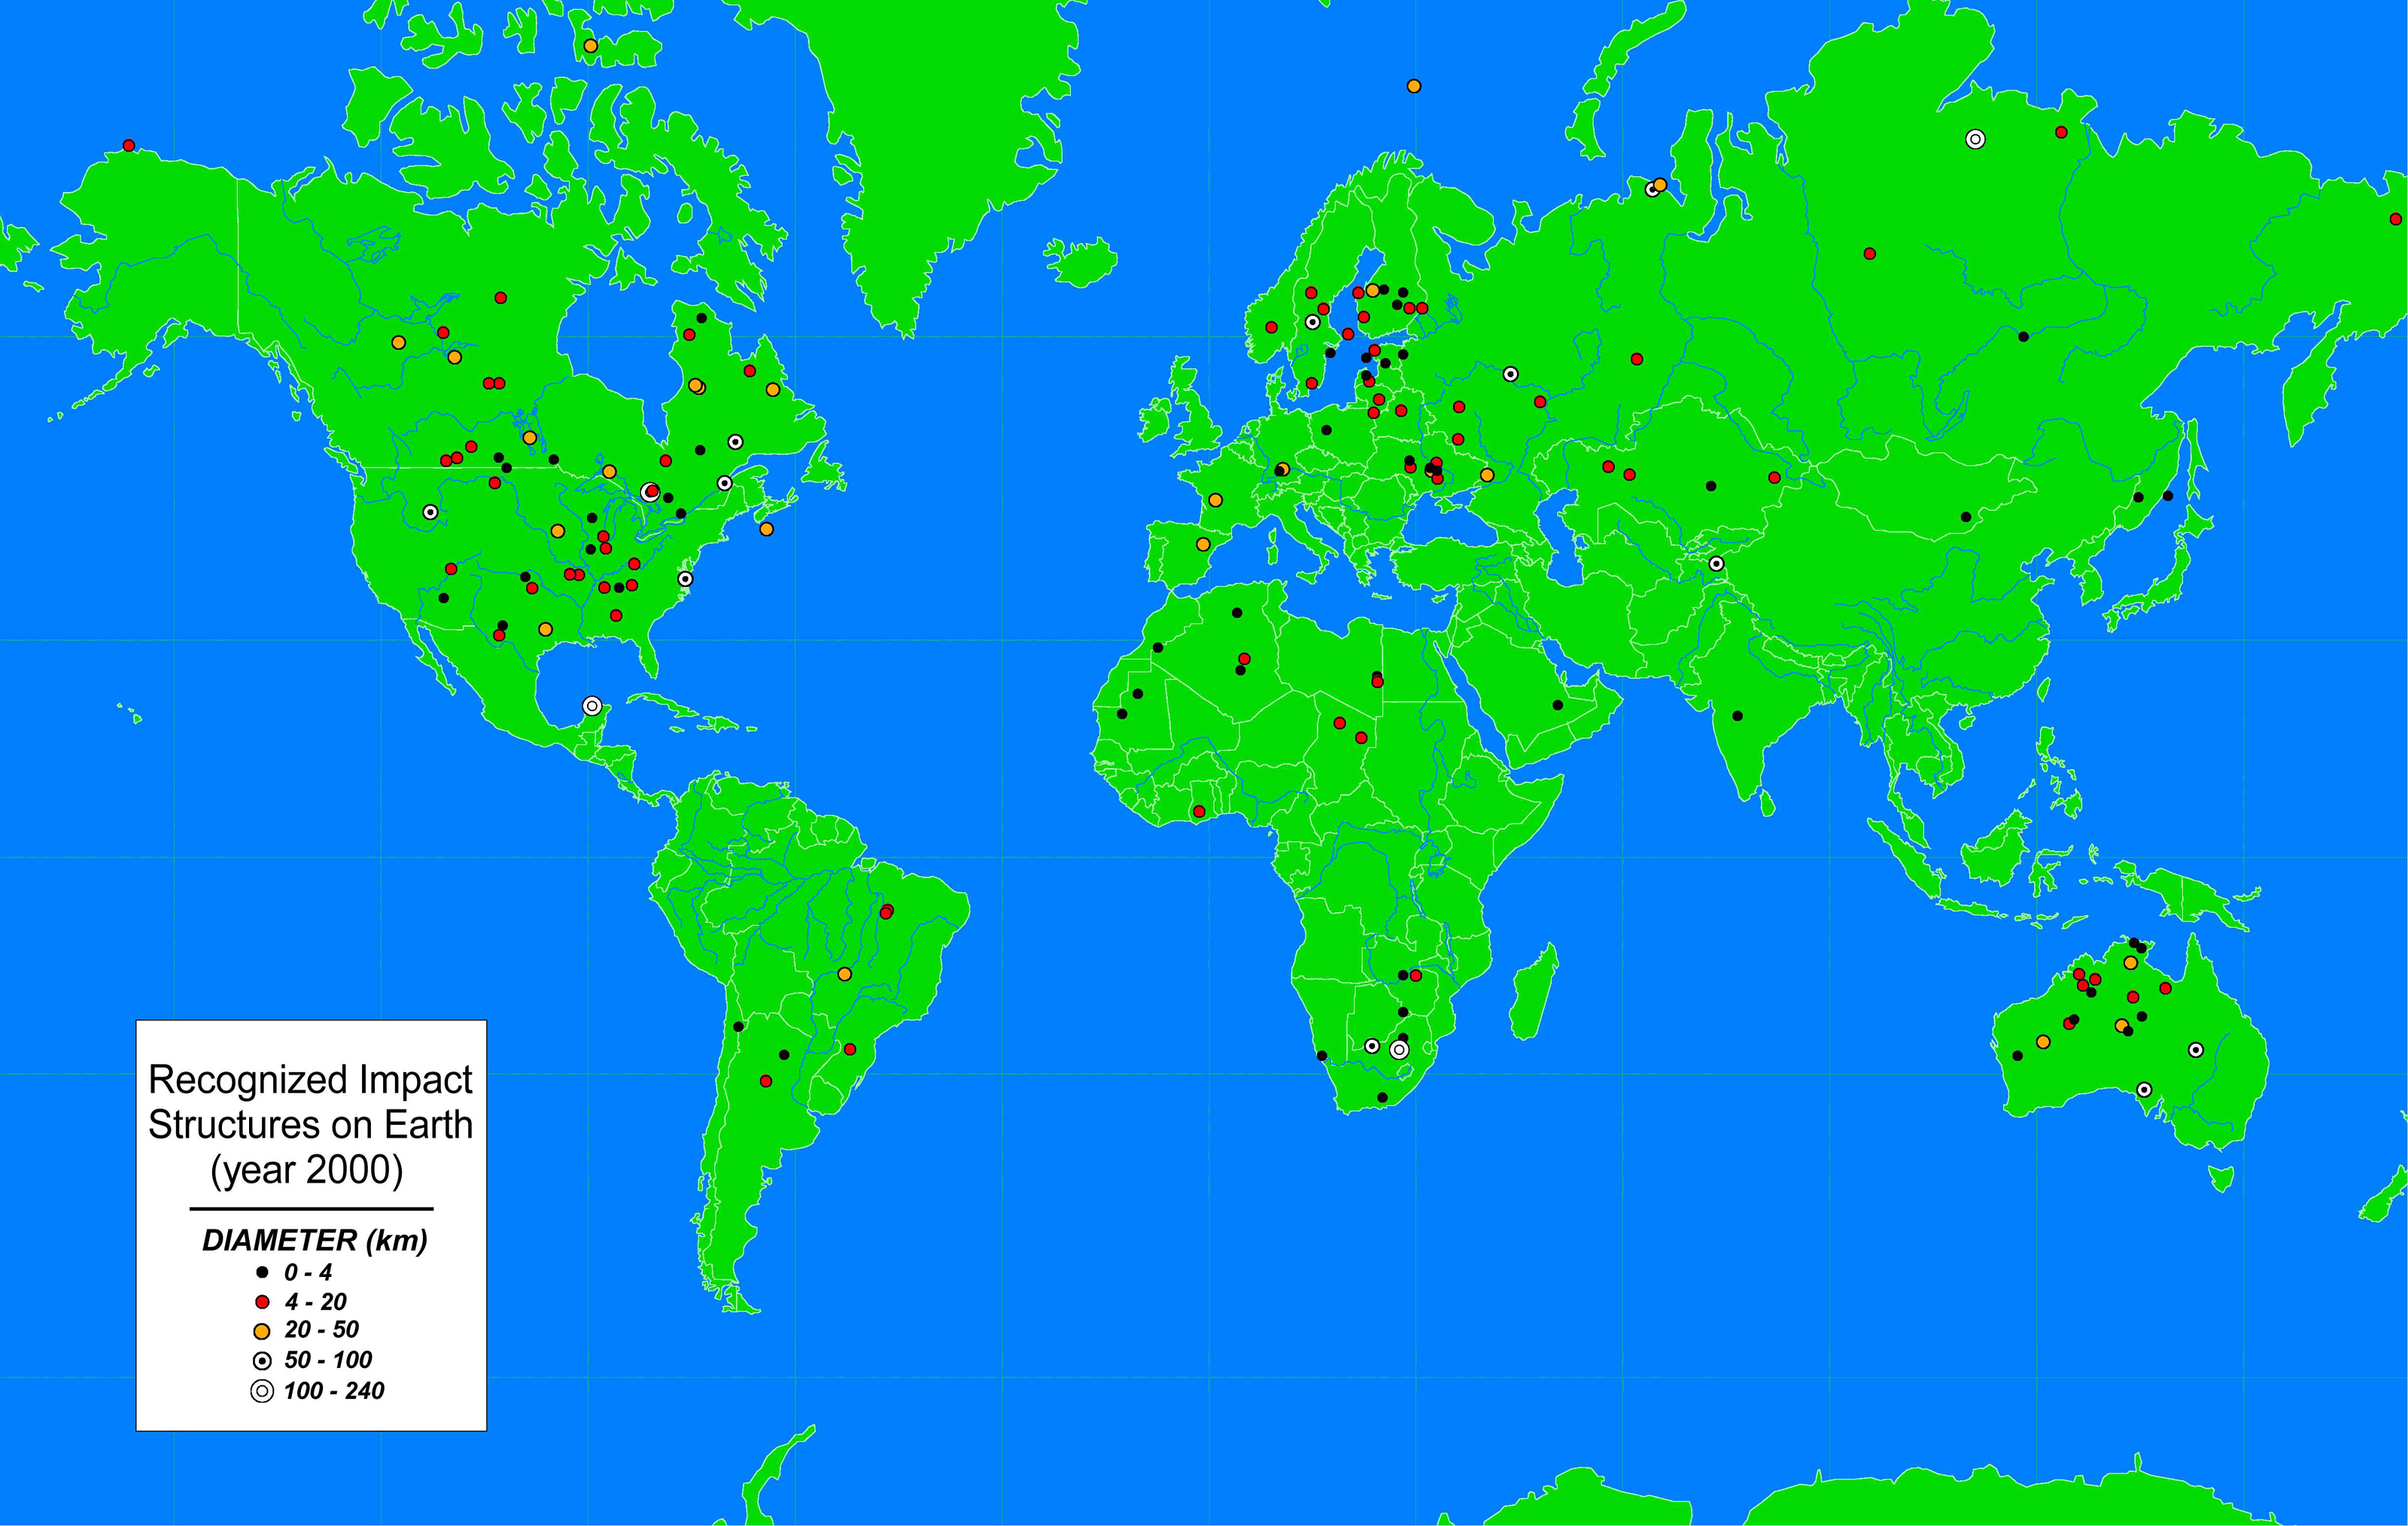
This map of all the world's recorded earthquakes between 1898 and 2003 is stunning. As you might expect, it also creates a brilliant outline of the plates of the Earth's crust—especially the infamous "Ring of Fire" around the Pacific Plate.
The plate boundaries are amazingly vivid in this geovisualization of the all the earthquakes over a 105 year span. How did scientist orginally come up with the theory of plate tectonics? How did spatial thinking and mapping play a role in that scientific endeavor?
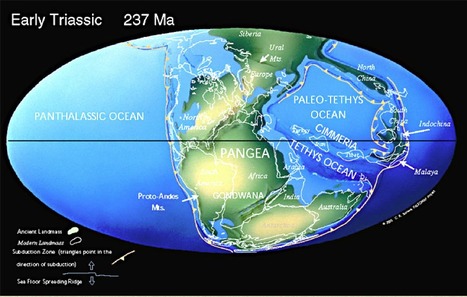
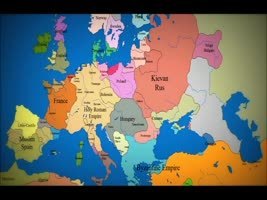
Select one of the times from the list on the left and travel through time and check out what the Earth looked liked in the far distant past or what it might look like far into the future. At each stop there is more information about the particular geological time period.
It took 200,000 years for our human population to reach 1 billion—and only 200 years to reach 7 billion. But growth has begun slowing, as women have fewer babies on average. When will our global population peak? And how can we minimize our impact on Earth’s resources, even as we approach 11 billion?
GRID-Arendal is a Norwegian foundation working closely with the United Nations Environment. We are working on projects all around the world on biodiversity, environmental crime, climate change and Indigenous Peoples.
GRID-Arendal graphics are free for attributed use. Please link the source to our site, credit the author, year and GRID-Arendal. All graphics are also available through flickr at www.flickr.com/photos/gridarendal. If you would like to download the full resolution PDF/EPS please click the "High-res download for publications" button and fill in your details to receive a download link via email.
For the first time, scientists at the Cornell Lab of Ornithology have created an animated map showing the migrations of birds over the course of a year.
Using millions of observations from the eBird citizen science database, the map's authors were able to document the migratory movements of 118 different species. Lead author Frank La Sorte said the data offered new insights into the birds' choice of routes.
The study found that birds that head out over the Atlantic Ocean to spend the winter in the Caribbean and South America tend to follow a clockwise loop, tracing a path farther inland on their return. These circuitous routes seem to help the birds take advantage of weaker headwinds in fall and stronger tailwinds in spring.
Species that don't fly over open water tend to hew to the same narrow routes in the spring and fall, following mountain chains or isthmuses. "After tracing the migration routes of all these species and comparing them, we concluded that a combination of geographic features and broad-scale atmospheric conditions influence the choice of routes used during spring and fall migration," La Sorte said.
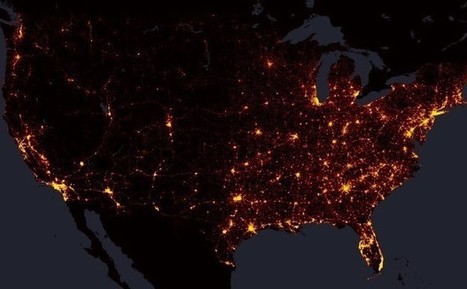
At the national level, Galka’s map almost looks like an electricity grid stretching across America’s road network—with bright orange clusters in metro areas connected via dim red threads across remote regions. Here’s a wide view of the whole country:
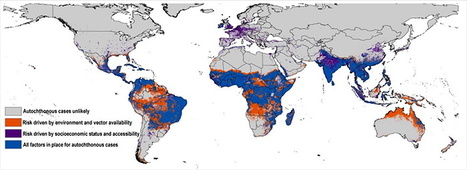
With Zika sparking anxiety at the Summer Olympic Games in Brazil, and now being transmitted in Florida through contact with mosquitoes, accurately mapping the distribution of the virus is increasingly urgent.
Accounting for a host of often-overlooked drivers of transmission, a team of University of Kansas researchers has mapped Zika risk around the world with unprecedented resolution while considering more factors than previous models.
The mapping effort uses ecological niche modeling, a technique used to predict distributions of species, to show the virus’ powerful ability to spread in South and Central America. This study is the first to evaluate the risk of Zika virus transmission in Europe, which appears relatively low. Research suggests parts of the southern U.S., including parts of Florida, Texas and Louisiana, are vulnerable to transmission of the virus.
“It’s the first detailed map that weighs different drivers of transmission,” said Abdallah Samy, who headed the research at the KU Biodiversity Institute. “We assessed different combinations of variables to see what are the major drivers — such as climate, or socioeconomics or people’s ability to access certain areas — and in the final map we merge all the variables.”
The resulting map predicts the likelihood of Zika exposure in the coming years by segmenting Earth’s landmasses into squares of 5-by-5 kilometers each and crunching the numbers for each of them.
Multiple factors influence risk assessment because the virus can spread through contact with mosquitoes in the genus Aedes, person-to-person via sexual contact, through blood transfusions and mother-to-child during pregnancy. The study focused on mosquito-driven transmission.
“For each area, we asked, ‘Is it mosquito exposure, climate or socioeconomic variables like accessibility for people to travel from areas where Zika is endemic and spread the virus upon their return?’” said Samy, who earned a doctorate in ecology and evolutionary biology at KU in May.
The findings recently were posted to the Zika Fast Track site and published in Memórias do Instituto Oswaldo Cruz, an international journal of biological and biomedical research based in Brazil, where the current outbreak has been centered since 2015.
For the first time, an international team of scientists from the European Society for Translational Antiviral Research (ESAR) has mapped the spread of the HIV virus around the globe after it reached the United States in the early 1970s.
The major study, published in the Journal of Molecular Epidemiology and Evolutionary Genetics of Infectious Diseases (MEEGID), finds that HIV travelled from the US to Western Europe on a number of occasions, whereas Central and Eastern Europe remained isolated for the most part of the early epidemic.
Analysis of thousands of genome sequences shows that geopolitical events such as the fall of the Iron Curtain had a big impact on human migration patterns within Europe and thus the spread of the virus through the continent.
Co-lead author Dr Gkikas Magiorkinis, of the Department of Zoology at Oxford University, said: 'The story of HIV up to its arrival in the US is already known. What happened after that, however, has been unclear. We wanted to see how HIV spread in the Western world.
'One of our main findings is that North America was spreading the virus much more than importing it, whereas Europe was absorbing the infection.'
Co-lead author Assistant Professor Dimitrios Paraskevis, of the Department of Hygiene, Epidemiology and Medical Statistics at the National and Kapodistrian University of Athens, said: 'Another striking finding is the clear segregation between Eastern and Western Europe in the early days of the virus, which probably has to do with the political situation on the continent. These distinct strains in Eastern and Western Europe were able to connect again in the 1990s once movement became less curtailed.'
Human immunodeficiency virus type 1 (HIV-1) was discovered in the early 1980s, when the virus had already established a pandemic. For at least three decades the epidemic in the Western world has been dominated by subtype B infections as part of a sub-epidemic that travelled from Africa through Haiti to the US. However, the pattern of the subsequent spread still remains poorly understood.
The researchers analysed almost 9,000 genomes of globally representative HIV-1 subtype B strains to map their spread around the world over the past 50 years and to highlight any significant spread patterns. They show that subtype B travelled from North America to Western Europe on different occasions, while Central and Eastern Europe remained isolated for the most part of the early epidemic.
Looking at Europe in more detail, the study shows that the UK, France and Switzerland all exchanged viral isolates more often with non-European countries than with European ones. The observed pattern is likely to mirror geopolitical landmarks in the post-World War II era – namely, the rise and fall of the Iron Curtain – and traditional links between countries as a result of European colonialism.
HIV-1 therefore spread along specific migration routes that are consistent with geopolitical factors that affected human activities during the past 50 years, such as migration, tourism and trade. The researchers say their findings support the argument that epidemic control policies should be global and incorporate political and socioeconomic factors.
WorldView-3, the world’s first multi-payload, super-spectral, high-resolution commercial satellite for earth observations and advanced geospatial solutions, launched into orbit on Aug. 13 aboard an Atlas rocket. Operating at an expected altitude of 617 km, WorldView-3 will have an average revisit time of less than one day and will be capable of collecting up to 680,000 square kilometers of imagery per day. Its data-rich imagery will discover new sources of minerals and fuels, manage forests and farms, and accelerate DigitalGlobe’s exploitation of Geospatial Big Data™ – a living digital inventory of the surface of the Earth.
The data should lead to much nicer imagery in online mapping services from companies like Google and Microsoft (both of which are DigitalGlobe customers), although it's not just cosmetic. Higher-res photos will help track large farms, spot mineral deposits and otherwise deliver a clearer view of our planet that has previously been limited to the government -- don't be surprised if it's easier to spot landmarks on a map without using markers.
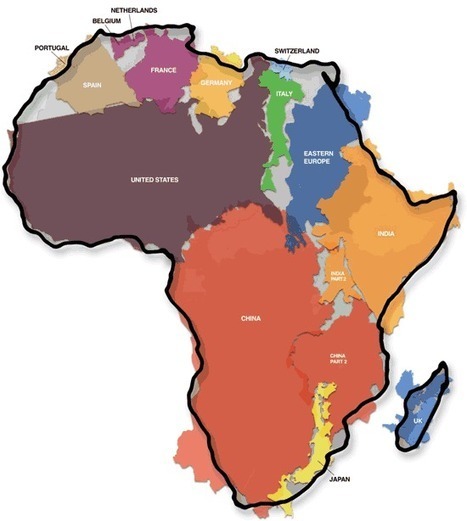
This is another old classic image that I might have shared earlier but it merits repeating. As Salvatore Natoli (a leader in geography education) once said, "In our society we unconsciously equate size with importance and even power." This is one reason why many people have underestimated the true size of Africa relative to places that they view as more important or more powerful.
As we can see, there's a little overlapping here and some empty spots but it's pretty accurate. The United States and China are in the top 5 largest countries of the world list and they still fit in the 2nd largest continent of the world, Africa. I'd like to see the size comparison between Africa and Russia. I did some research on that and it turns out that Russia is a little over half the size of Africa, maybe the size of the combination of the United States and China.
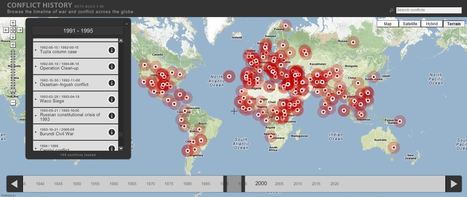
Browse the timeline of war and conflict across the globe.
This database of global wars and conflicts is searchable through space and time. You can drag and click both the map and timeline to locate particular battles and wars, and then read more information about that conflict. This resource would be a great one to show students and let them explore to find what they see as interesting. This site is brimming with potential.
the potential of this site is amazing between the interactive learning system and the correlation between the timeline and location. If the human geography class is anything like this i can't wait for it!
To get content containing either thought or leadership enter:
To get content containing both thought and leadership enter:
To get content containing the expression thought leadership enter:
You can enter several keywords and you can refine them whenever you want. Our suggestion engine uses more signals but entering a few keywords here will rapidly give you great content to curate.


 Your new post is loading...


