Your new post is loading...
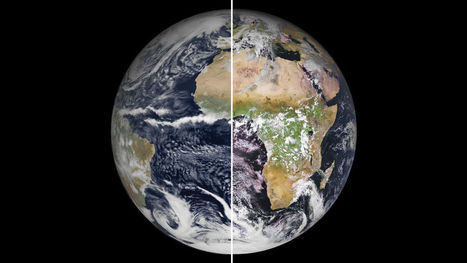
Ingesting more data than ever, exascale model will simulate the impact of climate change on humans The European Union is finalizing plans for an ambitious “digital twin” of planet Earth that would simulate the atmosphere, ocean, ice, and land with unrivaled precision, providing forecasts of floods, droughts, and fires from days to years in advance. Destination Earth, as the effort is called, won’t stop there: It will also attempt to capture human behavior, enabling leaders to see the impacts of weather events and climate change on society and gauge the effects of different climate policies. "It’s a really bold mission, I like it a lot,” says Ruby Leung, a climate scientist at the U.S. Department of Energy’s (DOE’s) Pacific Northwest National Laboratory. By rendering the planet’s atmosphere in boxes only 1 kilometer across, a scale many times finer than existing climate models, Destination Earth can base its forecasts on far more detailed real-time data than ever before. The project, which will be described in detail in two workshops later this month, will start next year and run on one of the three supercomputers that Europe will deploy in Finland, Italy, and Spain. Destination Earth rose out of the ashes of Extreme Earth, a proposal led by the European Centre for Medium-Range Weather Forecasts (ECMWF) for a billion-euro flagship research program. The European Union ultimately canceled the flagship program, but retained interest in the idea. Fears that Europe was falling behind China, Japan, and the United States in supercomputing led to the European High-Performance Computing Joint Undertaking, an €8 billion investment to lay the groundwork for eventual “exascale” machines capable of 1 billion billion calculations per second. The dormant Extreme Earth proposal offered a perfect use for such capacity. “This blows a soul into your digital infrastructure,” says Peter Bauer, ECMWF’s deputy director of research, who coordinated Extreme Earth and has been advising the European Union on the new program.
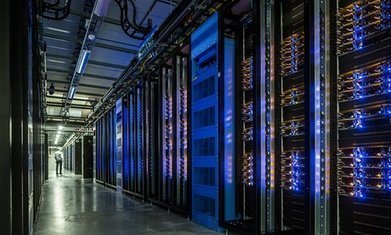
Watching another episode on Netflix, reading the Guardian online and downloading apps are not obvious ways to pollute the atmosphere. But collectively, our growing appetite for digital services means the data centers that power them are now responsible for about 2% of global greenhouse gas emissions, a similar share to aviation. Varying from a small room with servers to vast farms with a floor area of 150,000 square meters, data centers are big energy users. As well as requiring power to run the equipment that stores and serves us cloud computing and on-demand music, films and entertainment, those servers also generate a lot of heat and require huge amounts of energy to keep them cool. That’s why big data users such as Facebook are siting their centers in cool climates such as northern Sweden. Individually, our everyday browsing has a relatively minuscule impact. Google, in response to claims that each search on its site generated as much CO2 as boiling half the water for a cup of coffee (7g), calculated the true figure was much lower, at 0.2g. Watching a YouTube video of cats was higher – 1g for every 10 minutes of viewing – while using Gmail for a year produced about 1.2kg a user. Not to be outdone, Facebook put a figure on its average user’s annual footprint – 269g of CO2, roughly equivalent to the carbon footprint of a cup of coffee. But with the technology giants’ billions of users worldwide, those numbers scale up quickly. Google’s carbon footprint was 1,766,014 tons CO2 equivalent in 2013, and the bulk of that was from data centers. As with emissions from air travel, the real issue with data centers is the rate at which they are growing. “It’s an exponential growth in data,” said Sophia Flucker, director at Operational Intelligence, a UK-based consultancy that advises data centers on their energy use. “Although IT efficiency is improving, and we can do more with less power, the demand is still there,” she said. “Any efficiency gains are being eaten up by demand. It’s very much an upward trajectory.”
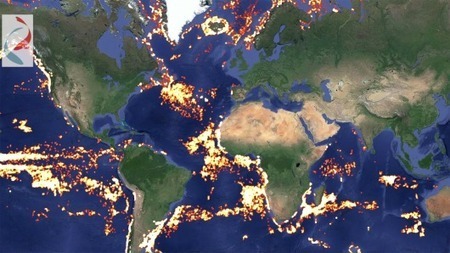
Google has partnered with SkyTruth and Oceana to produce a new tool to track global fishing activity. Known as Global Fishing Watch, the interactive web tool uses satellite data to provide detailed vessel tracking, and aims to harness the power of citizen engagement to tackle the issue of overfishing.
According to the United Nations Food and Agriculture Organization, more than 90 percent of the world’s fisheries are working at peak capacity, with as much as one-third of marine fish stocks now suffering from overfishing.
Though a clear issue, the distant and out-of-sight nature of commercial fishing creates a problem when it comes to accountability. To help combat this, Google has teamed up with marine advocacy group Oceana and mapping company SkyTruth to develop the Global Fishing Watch – a tool that allows anyone with an internet connection access to the timing and position of intensive fishing around the world.
Currently in the prototype stage, the tool makes use of Automatic Identification System (AIS) satellite location data – a tool initially designed to help avoid maritime collisions. The system analyses the movement pattern of each ship to determine whether it is indeed a fishing vessel, before plotting its activity on an interactive map.
Extreme summer rainfall may become more frequent in the UK due to climate change, according to new research led by the Met Office in collaboration with Newcastle University. The new study, from the joint Met Office and NERC funded CONVEX project, uses a state-of-the-art climate model providing the first evidence that hourly summer rainfall rates could increase.
While summers are expected to become drier overall by 2100, intense rainfall indicative of serious flash flooding could become several times more frequent.
The results from the study, published in Nature Climate Change, are the first step towards building a more complete picture of how UK rainfall may change as our climate warms.
Dr Lizzie Kendon, lead author of the research at the Met Office, said: "Until now, climate models haven't been able to simulate how extreme hourly rainfall might change in future. The very high resolution model used in this study allows us to examine these changes for the first time.
"It shows heavier summer downpours in the future, with almost five times more events exceeding 28mm in one hour in the future than in the current climate - changes we might expect theoretically as the world warms. However, we need to be careful as the result is only based on one model - so we need to wait for other centres to run similarly detailed simulations to see whether their results support these findings."
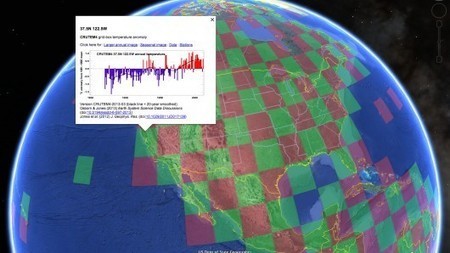
Climate researchers from the University of East Anglia (UEA) in the UK have just given people a whole lot more to talk about. As part of an ongoing effort to increase the accessibility and transparency of data on past climate and climate change, they've made one of the most widely used records of Earth's climate accessible through Google Earth.
Established in 1971, the UEA's Climate Research Unit (CRU) has become one of the leading institutions involved in the study of natural and anthropogenic climate change. Drawing on monthly weather records from some 6,000 weather stations around the globe, some dating back over 150 years, the researchers are responsible for Climatic Research Unit Temperature Version 4 (CRUTEM4), a widely used dataset of land-surface air temperatures.
By making CRUTEM4 data available through Google Earth, users can zoom in on any of the 6,000 weather stations, drill down through some 20,000 graphs and view monthly, seasonal and annual temperature data, some of which dates back to 1850. The interface places a red and green checkerboard over areas for where data is available. Since some remote areas lack weather stations, there are gaps in the checkerboard.
"The data itself comes from the latest CRUTEM4 figures, which have been freely available on our website and via the Met Office," said Dr Tim Osborn from the CRU. "But we wanted to make this key temperature dataset as interactive and user-friendly as possible. The beauty of using Google Earth is that you can instantly see where the weather stations are, zoom in on specific countries, and see station datasets much more clearly."
There are already a number of climate datasets available for Google Earth, including those from the US National Oceanic and Atmospheric Administration (NOAA). Those wishing to view these and the CRUTEM4 dataset need only download Google Earth and open the KML format files. Due to the sheer volume of data, the CRU researchers expect there will be a few errors in their dataset and are encouraging users to alert them to any unusual figures.
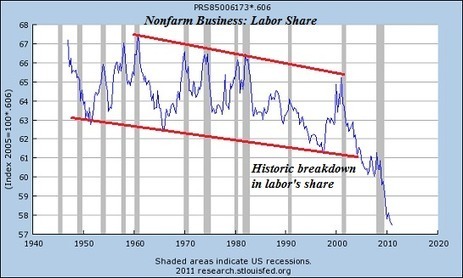
We will need to develop a “Third Way” based on community rather than the Market or the State to adapt to this reality, novelist and economic commentator Charles Hugh Smith writes on Business Insider. “The Internet is destroying vast income streams that once supported tens of thousands of jobs in industries from finance to music. Craigslist has gutted the once-immense income stream from newspapers, and web-based marketing has shredded print-media advert page counts. Global competition and pressure to maintain profits and margins relenetlessly drives enterprises to slash payrolls. As a society, we need to admit that ‘free-market’ capitalism is not going to bring back these lost jobs. Thanks to technology, society is capable of meeting basic human needs (food, clothing, shelter, transportation) with far fewer workers percentage-wise than were needed in the past. But as a society, we also need to admit that socialistic solutions won’t work either. I see community as the only viable way forward. Many aspects of human life cannot be turned into a ‘market opportunity,’ nor can they be taken over by the insolvent central-planning Central State. Paying people to stay home and rot is not a solution, but neither is paying people more than they produce in competitive markets. There is a ‘Third Way,’ but we’ve lost the skills and infrastructure required. Of the three elements of civil society, the Market and the State have crowded out Community. We either re-discover the labor-value of community or we devolve further into a potentially 'death spiral' social and financial instability.”
|
A new study published in the peer-reviewed journal Nature Climate Change finds that if Bitcoin is implemented at similar rates at which other technologies have been incorporated, it alone could produce enough emissions to raise global temperatures by 2°C as soon as 2033. "Bitcoin is a cryptocurrency with heavy hardware requirements, and this obviously translates into large electricity demands," said Randi Rollins, a master's student at the University of Hawaii at Manoa and coauthor of the paper. Purchasing with bitcoins and several other cryptocurrencies, which are forms of currency that exist digitally through encryption, requires large amounts of electricity. Bitcoin purchases create transactions that are recorded and processed by a group of individuals referred to as miners. Miners group every Bitcoin transaction made during a specific timeframe into a block. Blocks are then added to the chain, which is the public ledger. The verification process by miners, who compete to decipher a computationally demanding proof-of-work in exchange for bitcoins, requires large amounts of electricity. The electricity requirements of Bitcoin have created considerable difficulties, and extensive online discussion, about where to put the facilities or rings that compute the proof-of-work of Bitcoin. A somewhat less discussed issue is the environmental impacts of producing all that electricity. A team of UH Manoa researchers analyzed information such as the power efficiency of computers used by Bitcoin mining, the geographic location of the miners who likely computed the Bitcoin, and the CO2 emissions of producing electricity in those countries. Based on the data, the researchers estimated that the use of bitcoins in the year 2017 emitted 69 million metric tons of CO2. Researchers also studied how other technologies have been adopted by society, and created scenarios to estimate the cumulative emissions of Bitcoin should it grow at the rate that other technologies have been incorporated. The team found that if Bitcoin is incorporated, even at the slowest rate at which other technologies have been incorporated, its cumulative emissions will be enough to warm the planet above 2°C in just 22 years. If incorporated at the average rate of other technologies, it is closer to 16 years.
There’s no shortage of experts monitoring influenza outbreaks around the globe. The Centers for Disease Control and Prevention tracks flu activity in the United States year-round and produces weekly flu activity reports between the peak months of October to May. Likewise, the World Health Organisation constantly gathers epidemiological surveillance data, and releases updates on outbreaks taking place anywhere, anytime.
Still, despite the monitoring and the annual push to administer flu vaccines, influenza sickens millions of people around the world each year, leading to as many as 500,000 deaths annually. Young children and the elderly in particular are at risk. But what if we were better at predicting – and preparing for – seasonal outbreaks.That’s the impetus driving a team of researchers trying to show that it is possible to predict the timing and intensity of flu outbreaks in subtropical climates, such as Hong Kong, where flu seasons occur at irregular intervals throughout the year. The group, which includes scientists from Columbia University and the University of Hong Kong, has created a computer model to run various simulations of an outbreak and predict its magnitude and peak, according to a study published in the journal PLOS Computational Biology.
As a test case, the researchers gathering flu data from dozens of outpatient clinics and lab reports in Hong Kong between 1998 and 2013, then explored whether their system could accurately predict how outbreaks played out during those years. They said the program did remarkably well at predicting the peak of an outbreak several weeks in advance.
That’s not to say it was perfect. Researchers said the accuracy of the predictions varied, depending on the strength of an outbreak and how far in advance they tried to make a prediction. In addition, forecasts for specific strains of influenza proved more reliable than those for overall epidemics, and it was easier to predict the peak and magnitude of an outbreak than exactly when it would begin or how long it might last.
Scientists at IBM and Repsol SA, Spain largest energy company, announced today (Oct. 30) the world’s first research collaboration using cognitive technologies like IBM’s Watson to jointly develop and apply new tools to make it cheaper and easier to find new oil fields.
An engineer will typically have to manually read through an enormous set of journal papers and baseline reports with models of reservoir, well, facilities, production, export, and seismic imaging data. IBM says its cognitive technologies could help by analyzing hundreds of thousands of papers, prioritize data, and link that data to the specific decision at hand. It will introduce “new real-time factors to be considered, such as current news events around economic instability, political unrest, and natural disasters.”
The oil and gas industry boasts some of the most advanced geological, geophysical and chemical science in the world. But the challenge is to integrate critical geopolitical, economic, and other global news into decisions. And that will require a whole new approach to computing that can speed access to business insights, enhance strategic decision-making, and drive productivity, IBM says.
This goes beyond the capabilities of Watson. But scientists at IBM’s Cognitive Environments Laboratory (CEL), collaborating with Repsol, plan to develop and apply new prototype cognitive tools for real-world use cases in the oil and gas industry. They will experiment with a combination of traditional and new interfaces based upon spoken dialog, gesture, robotics and advanced visualization and navigation techniques.
The objective is build conceptual and geological models, highlight the impact of the potential risks and uncertainty, visualize trade-offs, and explore what-if scenarios to ensure the best decision is made, IBM says.
Repsol is making an initial investment of $15 million to $20 million to develop two applications targeted for next year, Repsol’s director for exploration and production technology Santiago Quesada explained to Bloomberg Business Week. “One app will be used for oil exploration and the other to help determine the most attractive oil and gas assets to buy.”
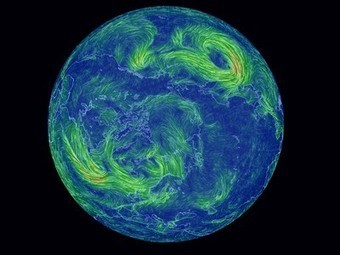
The wind has never been this beautiful! This interactive visualization of wind patterns all around the world is created by a script that downloads weather data from the Global Forecast System at the National Centers for Environmental Prediction, part of NOAA/the National Weather Service. This raw data is then rendered in your browser in the form of a globe that can be moved (drag with the mouse) and zoomed in and out of (use your mouse scroll wheel).
The data is updated every 3 hours, so it is pretty close to real-time considering that this isn't just a small local dataset but covers the whole planet. You can access it here: Earth Wind Map.
It reminds a little of this beautiful interactive animated wind map of the U.S., but it's even more beautiful, and it covers the whole planet.
|