 Your new post is loading...
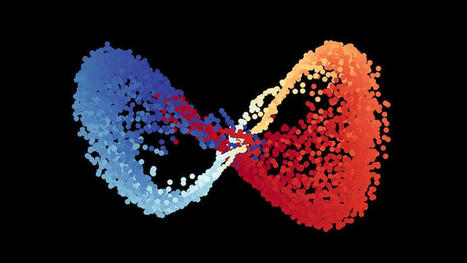
A new AI program observed physical phenomena and uncovered relevant variables—a necessary precursor to any physics theory. All physical laws are described as mathematical relationships between state variables. These variables give a complete and non-redundant description of the relevant system. However, despite the prevalence of computing power and artificial intelligence, the process of identifying the hidden state variables themselves has resisted automation. Most data-driven methods for modeling physical phenomena still rely on the assumption that the relevant state variables are already known. A longstanding question is whether it is possible to identify state variables from only high-dimensional observational data. Scientists now created a principle for determining how many state variables an observed system is likely to have, and what these variables might be. They were able to demonstrate the effectiveness of this approach using video recordings of a variety of physical dynamical systems, ranging from elastic double pendulums to fire flames. Without any prior knowledge of the underlying physics, our algorithm discovers the intrinsic dimension of the observed dynamics and identifies candidate sets of state variables. Github repository is here
While robots and computers will probably never completely replace doctors and nurses, machine learning/deep learning and AI are transforming the healthcare industry, improving outcomes, and changing the way doctors think about providing care. Machine learning is improving diagnostics, predicting outcomes, and just beginning to scratch the surface of personalized care. Imagine walking in to see your doctor with an ache or pain. After listening to your symptoms, she inputs them into her computer, which pulls up the latest research she might need to know about how to diagnose and treat your problem. You have an MRI or an X-ray and a computer helps the radiologist detect any problems that could be too small for a human to see. Finally, a computer looks at your medical records and family history and compares that with the best and most recent research to suggest a treatment protocol to your doctor that is specifically tailored to your needs. Industry analysts predict that 30 percent of providers will use cognitive analytics with patient data by 2018. It’s all starting to happen, and the implications are exciting. Diagnosis CBI insights identified 22 companies developing new programs for imaging and diagnostics. This is an especially promising field into which to introduce machine learning because computers and deep learning algorithms are getting more and more adept at recognizing patterns — which, in truth, is what much of diagnostics is about. An IBM-backed group called Pathway Genomics is developing a simple blood test to determine if early detection or prediction of certain cancers is possible. Lumiata has developed predictive analytics tools that can discover accurate insights and make predictions related to symptoms, diagnoses, procedures, and medications for individual patients or patient groups. Treatment IBM’s Watson has been tasked with helping oncologist make the best care decisions for their patients. The Care Trio team has developed a three-pronged approach that helps doctors devise and understand the best care protocols for cancer patients. The CareEdit tool helps teams create clinical practice guidelines that document the best course of treatment for different types of cancers. CareGuide uses the information from CareEdit into a “clinical decision support system” to help doctors choose the right treatment plan for an individual patient.
MIT researchers have developed a cryptographic system that could help neural networks identify promising drug candidates in massive pharmacological datasets, while keeping the data private. Secure computation done at such a massive scale could enable broad pooling of sensitive pharmacological data for predictive drug discovery. Datasets of drug-target interactions (DTI), which show whether candidate compounds act on target proteins, are critical in helping researchers develop new medications. Models can be trained to crunch datasets of known DTIs and then, using that information, find novel drug candidates. In recent years, pharmaceutical firms, universities, and other entities have become open to pooling pharmacological data into larger databases that can greatly improve training of these models. Due to intellectual property matters and other privacy concerns, however, these datasets remain limited in scope. Cryptography methods to secure the data are so computationally intensive they don't scale well to datasets beyond, say, tens of thousands of DTIs, which is relatively small. In a paper published in Science, researchers from MIT's Computer Science and Artificial Intelligence Laboratory (CSAIL) describe a neural network securely trained and tested on a dataset of more than a million DTIs. The network leverages modern cryptographic tools and optimization techniques to keep the input data private, while running quickly and efficiently at scale. The team's experiments show the network performs faster and more accurately than existing approaches; it can process massive datasets in days, whereas other cryptographic frameworks would take months. Moreover, the network identified several novel interactions, including one between the leukemia drug imatinib and an enzyme ErbB4—mutations of which have been associated with cancer—which could have clinical significance. "People realize they need to pool their data to greatly accelerate the drug discovery process and enable us, together, to make scientific advances in solving important human diseases, such as cancer or diabetes. But they don't have good ways of doing it," says corresponding author Bonnie Berger, the Simons Professor of Mathematics and a principal investigator at CSAIL. "With this work, we provide a way for these entities to efficiently pool and analyze their data at a very large scale."
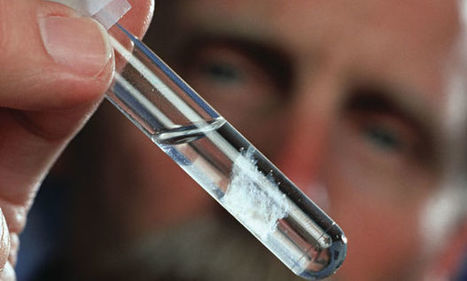
The latest in high-density ultra-durable data storage has been perfected over billions of years by nature itself. Now ‘Smoke on the Water’ is making history again. This September, it was one of the first items from the Memory Of the World archive to be stored in the form of DNA and then played back with 100% accuracy. The project was a joint effort between the University of Washington, Microsoft and Twist Bioscience, a San Francisco-based DNA manufacturing company. The demonstration was billed as a ‘proof of principle’ – which is shorthand for successful but too expensive to be practical. At least for now. Many pundits predict it’s just a matter of time till DNA pips magnetic tape as the ultimate way to store data. It’s compact, efficient and resilient. After all, it has been tweaked over billions of years into the perfect repository for genetic information. It will never become obsolete, because as long as there is life on Earth, we will be interested in decoding DNA. “Nature has optimised the format,” says Twist Bioscience’s chief technology officer Bill Peck. Players like Microsoft, IBM and Intel are showing signs of interest. In April, they joined other industry, academic and government experts at an invitation-only workshop (cosponsored by the U.S. Intelligence Advanced Research Projects Activity (IARPA)) to discuss the practical potential for DNA to solve humanity’s looming data storage crisis. It’s a big problem that’s getting bigger by the minute. According to a 2016 IBM Marketing Cloud report, 90% of the data that exists today was created in just the past two years. Every day, we generate another 2.5 quintillion (2.5 × 10¹⁸) bytes of information. It pours in from high definition video and photos, Big Data from particle physics, genomic sequencing, space probes, satellites, and remote sensing; from think tanks, covert surveillance operations, and Internet tracking algorithms. EVERY DAY, WE GENERATE ANOTHER 2.5 QUINTILLION BYTES OF INFORMATION. Right now all those bits and bytes flow into gigantic server farms, onto spinning hard drives or reels of state-of-the-art magnetic tape. These physical substrates occupy a lot of space. Compare this to DNA. The entire human genome, a code of three billion DNA base pairs, or in data speak, 3,000 megabytes, fits into a package that is invisible to the naked eye – the cell’s nucleus. A gram of DNA — the size of a drop of water on your fingertip — can store at least the equivalent of 233 computer hard drives weighing more than 150 kilograms. To store the all the genetic information in a human body — 150 zettabytes — on tape or hard drives, you’d need a facility covering thousands, if not millions of square feet. And then there’s durability. Of the current storage contenders, magnetic tape has the best lifespan, at about 10-20 years. Hard drives, CDs, DVDs and flash drives are less reliable, often failing within five to ten years. DNA has proven that it can survive thousands of years unscathed. In 2013, for example, the genome of an early horse relative was reconstructed from DNA from a 700,000-year-old bone fragment found in the Alaskan permafrost.
Via Integrated DNA Technologies
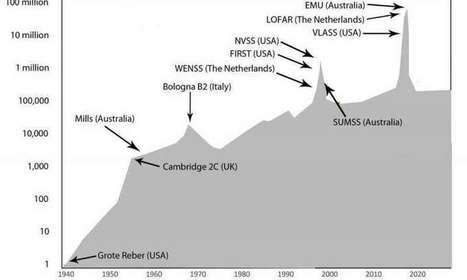
Radio astronomy is undergoing a major boost, with new technology gathering data on objects in our universe faster than astronomers can analyze. A good review of the state of radio astronomy is published in Nature Astronomy. Over the next few years, we will see the universe in a very different light, and we are likely to make completely unexpected discoveries. Radio telescopes view the sky using radio waves and mainly see jets of electrons traveling at the speed of light, propelled by super-massive black holes. That gives a very different view to the one we see when observing a clear night sky using visible light, which mainly sees light from stars. Black holes were only found in science fiction before radio astronomers discovered them in quasars. It now seems that most galaxies, including our own Milky Way, have a super-massive black hole at their center. .
The world is expanding and so is the data around. The concept of big data has never looked more fascinating than now. Businesses are now looking for patterns to implement big data technology directly into their business applications and software. The term has moved from being just a buzzword to one of the most essential components of a company’s IT infrastructure. Organizations are taking the next step to identify the current as well as future developments in big data deployments. Massive data sets from an ever-expanding list of sources are what define big data in the simplest way. Organizations are trying to create a culture where they can embed the technology in applications so that it can truly empower their business. Truly, big data has taken the business world by storm, but what next! How big is it going to get; will businesses using data see productivity benefits, are there any security concerns? Questions abound and so does their answers. However, differentiating between what will sustain and what will pass will save you time and most importantly, a wrong investment. Since long, big data solutions, has been introduced as massive sets built around centralized data lakes. The reasons were quite simple. The data became difficult to duplicate and management was easier. In 2016 though, organizations are thinking of moving to distributed big data processing, not to mention managing multiple data location centers and multiple devices. Further, the continued growth of the Internet of Things is increasingly going to affect the deployment of distributed data processing frameworks. The ever-expanding list of resources continues generating larger and larger volumes of data. There are a lot of data and there is going to be more. Data-driven companies like Google are stressing on data analysis and how it must be grounded in sound values and practices. Terabytes, petabytes, or exabytes - big data means huge amounts of data getting transferred between applications. The consistent back and forth of information is creating huge security concerns. Intrusions are detected on a daily basis and what’s worse is organizations are keeping security as their second or third priority. Hackers can breach any database if your security system gets easily defeated. Organizations with weak protection solutions will end up being victims of thousands of hackers out there. Get a top-notch anti-malware software program that will safeguard your perimeter and it won’t be pregnable. Experts debate when it comes to quality of data. According to them, big isn’t necessary whatsoever and business doesn’t use even a fraction of the data they have access to. The idea is moving from big to fast and actionable data that answer questions and produces effective uses of the data. Big data is going to get bigger no matter what. Don’t get left behind and adopt it as soon as possible. For effective data management and protection from intrusion, make sure you are securing your enterprise with top performance anti-malware solutions. If big data is expanding, then so has to be the scale, speed, security and integration requirements of your organization.
Via Fernando Gil
Birdsnap is a free electronic field guide covering 500 of the most common North American bird species, available as a web site or aniPhone app. Researchers from Columbia University and the University of Maryland developed Birdsnap using computer vision and machine learning to explore new ways of identifying bird species. Birdsnap automatically discovers visually similar species and makes visual suggestions for how they can be distinguished. In addition, Birdsnap uses visual recognition technology to allow users who upload bird images to search for visually similar species. Birdsnap estimates the likelihood of seeing each species at any location and time of year based on sightings records, and uses this likelihood both to produce a custom guide to local birds for each user and to improve the accuracy of visual recognition.
The genesis of Birdsnap (and its predecessors Leafnsap and Dogsnap) was the realization that many techniques used for face recognition developed by Peter Belhumeur (Columbia University) and David Jacobs(University of Maryland) could also be applied to automatic species identification. State-of-the-art face recognition algorithms rely on methods that find correspondences between comparable parts of different faces, so that, for example, a nose is compared to a nose, and an eye to an eye. In the same way, Birdsnap detects the parts of a bird, so that it can examine the visual similarity of comparable parts of the bird.Our first electronic field guide Leafsnap, produced in collaboration with the Smithsonian Institution, was launched in May 2011. This free iPhone app uses visual recognition software to help identify tree species from photographs of their leaves. Leafsnap currently includes the trees of the northeastern US and will soon grow to include the trees of the United Kingdom. Leafsnap has been downloaded by over a million users, and discussed extensively in the press (see Leafsnap.com, for more information). In 2012, we launched Dogsnap, an iPhone app that allows you to use visual recognition to help determine dog breeds. Dogsnap contains images and textual descriptions of over 150 breeds of dogs recognized by the American Kennel Club.
For their inspiration and advice on bird identification, we thank the UCSD Computer Vision group, especially Serge Belongie, Catherine Wah, and Grant Van Horn; the Caltech Computational Vision group, especially Pietro Perona, Peter Welinder, and Steve Branson; the alumni of these groups Ryan Farrell (now at BYU), Florian Schroff (at Google), and Takeshi Mita (at Toshiba); and the Visipedia effort.
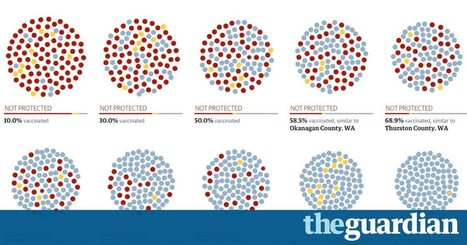
If you take 10 communities and run a simulation, it’s easy to see why we need as many members of the ‘herd’ as possible to get vaccines – before it’s too late. Measles are back in the US – and spreading. More than 100 cases across 14 states and Washington DC have been confirmed by US health officials since an outbreak began at Disneyland last December. With a majority of those infections in unvaccinated people, widespread blame – from Washington to the rest of the world – has fallen on parents who chose not to vaccinate their children. Part of the problem, according to Dr Elizabeth Edwards, professor of pediatrics and director of the Vanderbilt Vaccine Research Program, is just that: vaccination is understood by many as an individual choice, when science makes clear that the choice – to vaccinate or not to vaccinate – can affect an entire community. “When you immunize your child, you’re not only immunizing your child. That child’s immunization is contributing to the control of the disease in the population,” Edwards explained. That sheltering effect is called herd immunity: a population that is highly immunized makes for a virus that can’t spread easily, providing protection to the community – or the herd – as a whole. Despite the high overall measles vaccination rate in the US, vaccine skeptics – and their unimmunized kids – often congregate in like-minded communities, creating pockets of under-immunization. California, where the bulk of current measles cases can still be found, is a prime example. It's one of 20 states that allow parents to skip vaccination based on their personal, philosophical beliefs – even though legislators introduced a bill that would ban such an opt-out provision.
Via Neelima Sinha
Last year, MIT researchers presented a system that automated a crucial step in big-data analysis: the selection of a "feature set," or aspects of the data that are useful for making predictions. The researchers entered the system in several data science contests, where it outperformed most of the human competitors and took only hours instead of months to perform its analyses. Now, in a pair of papers at the IEEE International Conference on Data Science and Advanced Analytics, the team described an approach to automating most of the rest of the process of big-data analysis—the preparation of the data for analysis and even the specification of problems that the analysis might be able to solve. The researchers believe that, again, their systems could perform in days tasks that used to take data scientists months. "The goal of all this is to present the interesting stuff to the data scientists so that they can more quickly address all these new data sets that are coming in," says Max Kanter MEng '15, who is first author on last year's paper and one of this year's papers. "Data scientists want to know, 'Why don't you show me the top 10 things that I can do the best, and then I'll dig down into those?' So, these methods are shrinking the time between getting a data set and actually producing value out of it." Both papers focus on time-varying data, which reflects observations made over time, and they assume that the goal of analysis is to produce a probabilistic model that will predict future events on the basis of current observations. The first paper describes a general framework for analyzing time-varying data. It splits the analytic process into three stages: labeling the data, or categorizing salient data points so they can be fed to a machine-learning system; segmenting the data, or determining which time sequences of data points are relevant to which problems; and "featurizing" the data, the step performed by the system the researchers presented last year. The second paper describes a new language for describing data-analysis problems and a set of algorithms that automatically recombine data in different ways, to determine what types of prediction problems the data might be useful for solving. According to Kalyan Veeramachaneni, a principal research scientist at MIT's Laboratory for Information and Decision Systems and senior author on all three papers, the work grew out of his team's experience with real data-analysis problems brought to it by industry researchers.
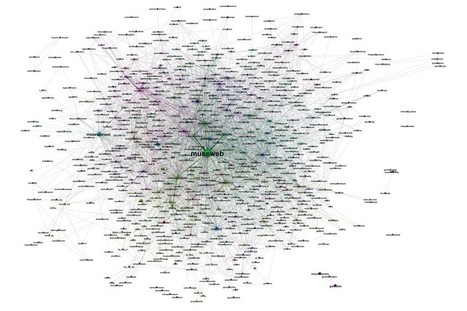
In 2014 at the Museums and the Web conferences in Baltimore, Maryland, and Florence, Italy, a group of data scientists presented a report on how two thousand museums were relating on Twitter. After our presentation, they decided to continue their investigation in two directions: The first are the case studies. They wanted to analyze some museums' Twitter environments, e.g., how museums are relating to their followers, how they form different communities defined by underlying relationships, the growth of the network around a museum, detection of influencers, etc. They also wanted to study how to use this information in order to design better social-media strategies for an improved and more realistic assessment of the work and actions’ results on Twitter. Case studies from London's Victoria & Albert, Turin's Palazzo Madama, and Barcelona's Center for Contemporary Culture have chosen museums with different Twitter strategies, countries, languages, and follower bases ranging from 7,000 at the time of writing this abstract (Palazzo Madama) to the 450,000 from V&A. The goal was to have different situations represented and run a useful research for museums of different sizes. The second direction nowadays is how museum professionals are interacting with each other on Twitter thanks to the use of hashtags, like #musetech, in order to share information, questions, and experiences.
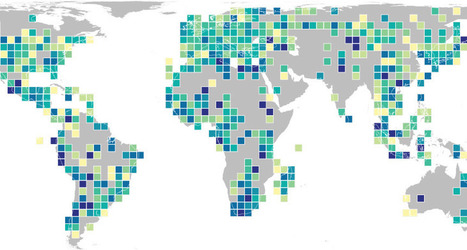
Maps have long been used to show the animal kingdom’srange, regional mix, populations at risk and more. Now a new set of maps reveals the global distribution of genetic diversity. “Without genetic diversity, species can’t evolve into new species,” says Andreia Miraldo, a population geneticist at the Natural History Museum of Denmark in Copenhagen. “It also plays a fundamental role in allowing species populations to adapt to changes in their environment.” Miraldo and her colleagues gathered geographical coordinates for more than 92,000 records of mitochondrial DNA from 4,675 species of land mammals and amphibians. The researchers compared changes in cytochrome b, a gene often used to measure genetic diversity within a species, and then mapped the average genetic diversity for all species within roughly 150,000 square-kilometer areas.
There is no unified place where genomics researchers can search through all available raw genomic data in a way similar to OMIM for genes or Uniprot for proteins. With the recent increase in the amount of genomic data that is being produced and the ever-growing promises of precision medicine, this is becoming more and more of a problem. DNAdigest is a charity working to promote efficient sharing of human genomic data to improve the outcome of genomic research and diagnostics for the benefit of patients. Repositive, a social enterprise spin-out of DNAdigest, is building an online platform that indexes genomic data stored in repositories and thus enables researchers to search for and access a range of human genomic data sources through a single, easy-to-use interface, free of charge.
If DNA archives become a plausible method of data storage, it will be thanks to rapid advances in genetic technologies. The sequencing machines that “read out” DNA code have already become exponentially faster and cheaper; the National Institutes of Health shows costs for sequencing a 3-billion-letter genome plummeting from US $100 million in 2001 to a mere $1,000 today. However, DNA synthesis technologies required to “write” the code are much newer and less mature. Synthetic-biology companies like San Francisco’s Twist Biosciencehave begun manufacturing DNA to customers’ specifications only in the last few years, primarily serving biotechnology companies that are tweaking the genomes of microbes to trick them into making some desirable product. Manufacturing DNA for data storage could be a profitable new market, says Twist CEO Emily Leproust. Twist sent a representative to the April meeting, and the company is also working with Microsoft on a separate experiment in DNA storage, in which it synthesized 10 million strands of DNA to encode Microsoft’s test file. Leproust says Microsoft and the other tech companies are currently trying to determine “what kind of R&D has to be done to make a viable commercial product.” To make a product that’s competitive with magnetic tape for long-term storage, Leproust estimates that the cost of DNA synthesis must fall to 1/10,000 of today’s price. “That is hard,” she says mildly. But, she adds, her industry can take inspiration from semiconductor manufacturing, where costs have dropped far more dramatically. And just last month, an influential group of geneticists proposed an international effort to reduce the cost of DNA synthesis, suggesting that $100 million could launch the project nicely.
|
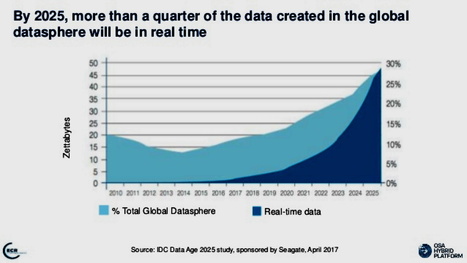
A large hard drive for a personal computer might have a terabyte of storage capacity. Now imagine filling one of those with data every day for around 161 million years, and you’ll have an idea how much data will be “created, captured, copied and consumed” in 2020 alone, according to market intelligence firm International Data Corporation (IDC). This month, IDC released its updated Global DataSphere forecast, predicting more than 59 zettabytes of data creation and consumption within the year and a 26% compound growth rate in data growth through 2024. This massive amount of data – nearly double the data used in 2018 – will be enough that the next three years of data creation and consumption will eclipse that of the previous 30 years. These projections are roughly in line with IDC’s estimates from late 2018, which forecasted ~50 zettabytes of data use in 2020 and 175 zettabytes of data use by 2025. Perhaps most notably, the forecast shows a dramatic uptick in data consumption due to the boom in work-from-home activity caused by COVID-19. (This uptick is not shared by data creation, which has been slightly stymied by the pandemic.) IDC expects the gap between content creation and consumption to widen over the next few years, moving from a 1:9 ratio to a 1:10 ratio by 2024. “Growth of the Global DataSphere is driven more by the data that we consume and analyze than what we create,” said David Reinsel, senior vice president for the Global DataSphere program. “Obviously, data must be created before it can be analyzed, but the recursion rate of data – the rate at which the same data is processed again – continues to grow exponentially driving the ‘unique’ DataSphere down to 10% of the total DataSphere.” IDC expects that productivity data will quickly expand, with total enterprise data use gaining 4% on consumer data use (which stands at around 50%). Furthermore, IDC projects drastic increases in metadata and sensor data, potentially surpassing all other data types in the near future. Overall, 40% of the DataSphere is expected to be attributable to entertainment data (like Netflix), with productivity tools also driving an increase in video data use. “We live in an increasingly video-enabled and video-assisted world, and consume an increasing amount of entertainment video each year – these are key factors driving the growth of the Global DataSphere,” said John Rydning, research vice president for the Global DataSphere program. “At the same time, we are steadily making more productive use of the video data we capture, which is contributing to the growth of productivity data in the DataSphere.”
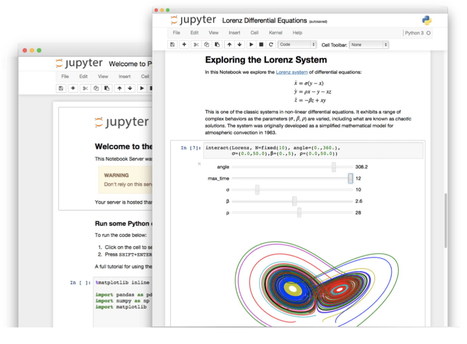
An improved architecture and enthusiastic user base are driving uptake of the open-source web tool. Perched atop the Cerro Pachón ridge in the Chilean Andes is a building site that will eventually become the Large Synoptic Survey Telescope (LSST). When it comes online in 2022, the telescope will generate terabytes of data each night as it surveys the southern skies automatically. And to crunch those data, astronomers will use a familiar and increasingly popular tool: the Jupyter notebook. Jupyter is a free, open-source, interactive web tool known as a computational notebook, which researchers can use to combine software code, computational output, explanatory text and multimedia resources in a single document. Computational notebooks have been around for decades, but Jupyter in particular has exploded in popularity over the past couple of years. This rapid uptake has been aided by an enthusiastic community of user–developers and a redesigned architecture that allows the notebook to speak dozens of programming languages — a fact reflected in its name, which was inspired, according to co-founder Fernando Pérez, by the programming languages Julia (Ju), Python (Py) and R. One analysis of the code-sharing site GitHub counted more than 2.5 million public Jupyter notebooks in September 2018, up from 200,000 or so in 2015. In part, says Pérez, that growth is due to improvements in the web software that drives applications such as Gmail and Google Docs; the maturation of scientific Python and data science; and, especially, the ease with which notebooks facilitate access to remote data that might otherwise be impractical to download — such as from the LSST. “In many cases, it’s much easier to move the computer to the data than the data to the computer,” says Pérez of Jupyter’s cloud-based capabilities. “What this architecture helps to do is to say, you tell me where your data is, and I’ll give you a computer right there.” For data scientists, Jupyter has emerged as a de facto standard, says Lorena Barba, a mechanical and aeronautical engineer at George Washington University in Washington DC. Mario Jurić, an astronomer at the University of Washington in Seattle who coordinates the LSST’s data-management team, says: “I’ve never seen any migration this fast. It’s just amazing.” Computational notebooks are essentially laboratory notebooks for scientific computing. Instead of pasting, say, DNA gels alongside lab protocols, researchers embed code, data and text to document their computational methods. The result, says Jupyter co-creator Brian Granger at California Polytechnic State University in San Luis Obispo, is a “computational narrative” — a document that allows researchers to supplement their code and data with analysis, hypotheses and conjecture. For data scientists, that format can drive exploration. Notebooks, Barba says, are a form of interactive computing, an environment in which users execute code, see what happens, modify and repeat in a kind of iterative conversation between researcher and data. They aren’t the only forum for such conversations — IPython, the interactive Python interpreter on which Jupyter’s predecessor, IPython Notebook, was built, is another. But notebooks allow users to document those conversations, building “more powerful connections between topics, theories, data and results”, Barba says. Researchers can also use notebooks to create tutorials or interactive manuals for their software. This is what Mackenzie Mathis, a systems neuroscientist at Harvard University in Cambridge, Massachusetts, did for DeepLabCut, a programming library her team developed for behavioural-neuroscience research. And they can use notebooks to prepare manuscripts, or as teaching aids. Barba, who has implemented notebooks in every course she has taught since 2013, related at a keynote address in 2014 that notebooks allow her students to interactively engage with — and absorb material from — lessons in a way that lectures cannot match. “IPython notebooks are really a killer app for teaching computing in science and engineering,” she said. The Jupyter notebook has two components. Users input programming code or text in rectangular cells in a front-end web page. The browser then passes that code to a back-end ‘kernel’, which runs the code and returns the results (see our example at go.nature.com/2yqq7ak). By Pérez’s count, more than 100 Jupyter kernels have been created, supporting dozens of programming languages. Normally, each notebook can run only one kernel and one language, but workarounds exist. One demo notebook, for instance, speaks Python, Julia, R and Fortran. Importantly, the kernels need not reside on the user’s computer. When future users of the LSST use Jupyter notebooks to analyse their data, the code will be running on a supercomputer in Illinois, providing computational muscle no desktop PC could match. Notebooks can also run in the cloud. Google’s Colaboratory project, for instance, provides a Google-themed front-end to the Jupyter notebook. It enables users to collaborate and run code that exploits Google’s cloud resources — such as graphical processing units — and to save their documents on Google Drive. Jupyter’s newest variant is JupyterLab, which launched as a beta in January 2018 and is available (like the Jupyter notebook) either as a stand-alone package or as part of the free Anaconda scientific-computing environment. Jason Grout is a software engineer at the financial-services company Bloomberg in San Francisco, California, and a member of the JupyterLab team. He calls JupyterLab a “next-generation web interface” for the Jupyter notebook — one that extends the familiar notebook metaphor with drag-and-drop functionality, as well as file browsers, data viewers, text editors and a command console. Whereas the standard Jupyter notebook assigns each notebook its own kernel, JupyterLab creates a computing environment that allows these components to be shared. Thus, a user could view a notebook in one window, edit a required data file in another, and log all executed commands in a third — all within a single web-browser interface. Users can also customize JupyterLab to fit their workflow. Built-in viewers exist for image, text and CSV files, for instance, but users can build custom components as well. These could display things such as genomic alignments or geospatial data. An attendee on a course taught by Pérez even created a component to display 3D brain-imaging data. “This is a completely [neuroscience] domain-specific tool, obviously — the Jupyter team has no business writing these things. But we provide the right standards, and then that community in 24 hours can come back and write one,” he says.
Via THE OFFICIAL ANDREASCY
University of Washington and Microsoft researchers revealed today that they have taken a significant step forward in their quest to develop a DNA-based storage system for digital data. In a paper published in Nature Biotechnology, the members of the Molecular Information Systems Laboratory (MISL) describe the science behind their world record-setting achievement of 200 megabytes stored in synthetic DNA. They also present their system for random access — that is, the selective retrieval of individual data files encoded in more than 13 million DNA oligonucleotides. While this is not the first time researchers have achieved random access in DNA, the UW and Microsoft team have produced the first demonstration of random access at such a large scale. One of the big advantages to DNA as a digital storage medium is its ability to store vast quantities of information, with a raw limit of one exabyte — equivalent to one billion gigabytes — per cubic millimeter. The data must be converted from digital 0s and 1s to the molecules of DNA: adenine, thymine, cytosine, and guanine. To restore the data to its digital form, the DNA is sequenced and the files decoded back to 0s and 1s. This process becomes more daunting as the amount of data increases — without the ability to perform random access, the entire dataset would have to be sequenced and decoded in bulk in order to find and retrieve specific files. In addition, the DNA synthesis and sequencing processes are error-prone, which can result in data loss. MISL researchers addressed these problems by designing and validating an extensive library of primers for use in conjunction with polymerase chain reaction (PCR) to achieve random access. Before synthesizing the DNA containing data from a file, the researchers appended both ends of each DNA sequence with PCR primer targets from the primer library. They then used these primers later to select the desired strands through random access, and used a new algorithm designed to more efficiently decode and restore the data to its original, digital state. “Our work reduces the effort, both in sequencing capacity and in processing, to completely recover information stored in DNA,” explained Microsoft Senior Researcher Sergey Yekhanin, who was instrumental in creating the codec and algorithms used to achieve the team’s results. “For the latter, we have devised new algorithms that are more tolerant to errors in writing and reading DNA sequences to minimize the effort in recovering this information.” Using synthetic DNA supplied by Twist Bioscience, the MISL team encoded and successfully retrieved 35 distinct files ranging in size from 29 kilobytes to over 44 megabytes — amounting to a record-setting 200 megabytes of high-definition video, audio, images, and text. This represents a significant increase over the previous record of 22 megabytes set by researchers from Harvard Medical School and Technicolor Research & Innovation in Germany. “The intersection of biotech and computer architecture is incredibly promising and we are excited to detail our results to the community,” said Allen School professor Luis Ceze, who co-leads the MISL. “Since this paper was submitted for publication we have reached over 400 megabytes, and we are still growing and learning more about large-scale DNA data storage.”
Via Integrated DNA Technologies
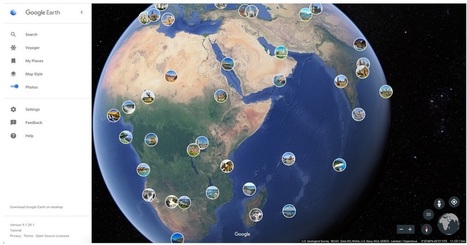
While Google Street View and Google Earth already give us a good view of whichever place we want to take a look at almost anywhere in the world, there is also nothing like seeing those places through the lens of another person who is actually there or who have been there. Google Earth now includes a global map of crowdsourced photos which you can consult when making travel plans, doing research for school, or just dreaming about another place far away from your home.
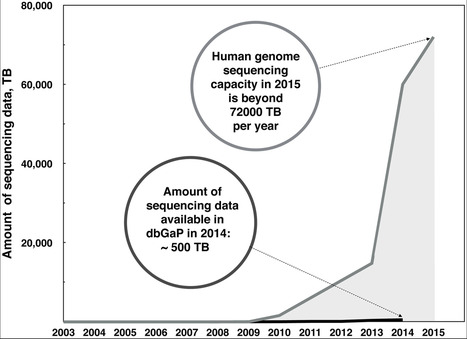
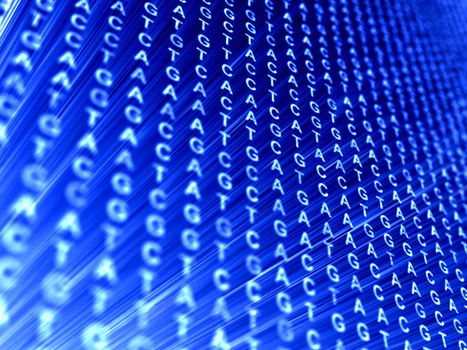
In the age of Big Data, it turns out that the largest, fastest growing data source lies within your cells. Quantitative biologists at the University of Illinois Urbana-Champaign and Cold Spring Harbor Laboratory, in New York, found that genomics reigns as champion over three of the biggest data domains around: astronomy, Twitter, and YouTube. The scientists determined which would expand the fastest by evaluating acquisition, storage, distribution, and analysis of each set of data. Genomes are quantified by their chemical constructs, or base pairs. Genomics trumps other data generators because the genome sequencing rate doubles every seven months. If it maintains this rate, by 2020 more than one billion billion bases will be sequenced and stored per year, or 1 exabase. By 2025, researchers estimate the rate will be almost one zettabase, one trillion billion bases, per sequence per year. “What does it mean to have more genomes than people on the planet?”—Michael Schatz, Cold Spring Harbor Laboratory 90 percent of the genome data analyzed in the study was human. The scientists estimate that 100 million to 2 billion human genomes will be sequenced by 2025. That’s a four to five order of magnitude of growth in ten years, which far exceeds the other three data generators they studied. “For human genomics, which is the biggest driver of the whole field, the hope is that by sequencing many, many individuals, that knowledge will be obtained to help predict and cure a variety of diseases,” says University of Illinois Urbana-Champaign co-author, Gene Robinson. Before it can be useful for medicine, genomes must be coupled with other genomic data sets, including tissue information. One reason the rate is doubling so quickly is because scientists have begun sequencing individual cells. Single-cell genome sequencing technology for cancer research can reveal mutated sequences and aid in diagnosis. Patients may have multiple single cells sequenced, and there could end up being more than 7 billion genomes sequenced. That “is more than the population of the Earth,” says Michael Schatz, associate professor at Cold Spring Harbor Laboratory, in New York. “What does it mean to have more genomes than people on the planet?” What it means is a mountain of information must be collected, filed, and analyzed. “Other disciplines have been really successful at these scales, like YouTube,” says Schatz. Today, YouTube users upload 300 hours of video every minute, and the researchers expect that rate to grow up to 1,700 hours per minute, or 2 exabytes of video data per year, by 2025. Google set up a seamless data-flowing infrastructure for YouTube. They provided really fast Internet, huge hard drive space, algorithms that optimized results, and a team of experienced researchers.
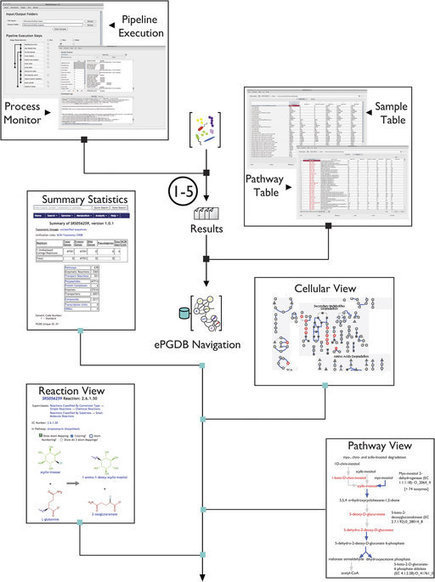
Advances in high-throughput sequencing are reshaping how we perceive microbial communities inhabiting the human body, with implications for therapeutic interventions. Several large-scale datasets derived from hundreds of human microbiome samples sourced from multiple studies are now publicly available. However, idiosyncratic data processing methods between studies introduce systematic differences that confound comparative analyses. To overcome these challenges, scientists developed GUTCYC, a compendium of environmental pathway genome databases (ePGDBs) constructed from 418 assembled human microbiome datasets using METAPATHWAYS, enabling reproducible functional metagenomic annotation. They also generated metabolic network reconstructions for each metagenome using the PATHWAYTOOLS software, empowering researchers and clinicians interested in visualizing and interpreting metabolic pathways encoded by the human gut microbiome. For the first time, GUTCYC provides consistent annotations and metabolic pathway predictions, making possible comparative community analyses between health and disease states in inflammatory bowel disease, Crohn’s disease, and type 2 diabetes. GUTCYC data products are searchable online, or may be downloaded and explored locally using METAPATHWAYS and PATHWAY TOOLS.
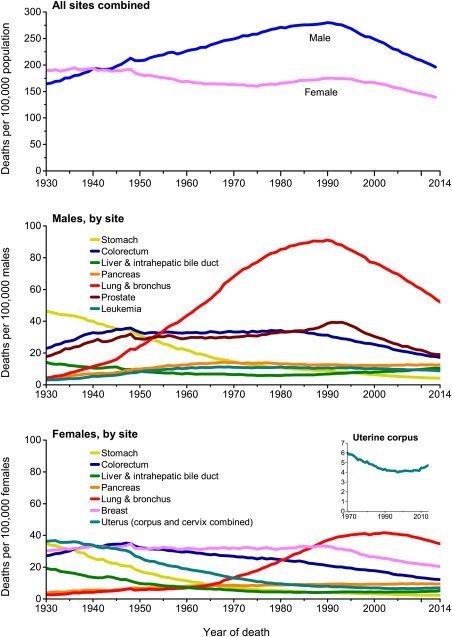
Each year, the American Cancer Society estimates the numbers of new cancer cases and deaths that will occur in the United States in the current year and compiles the most recent data on cancer incidence, mortality, and survival. Incidence data were collected by the Surveillance, Epidemiology, and End Results Program; the National Program of Cancer Registries; and the North American Association of Central Cancer Registries. Mortality data were collected by the National Center for Health Statistics. In 2017, 1,688,780 new cancer cases and 600,920 cancer deaths are projected to occur in the United States. For all sites combined, the cancer incidence rate is 20% higher in men than in women, while the cancer death rate is 40% higher. However, sex disparities vary by cancer type. For example, thyroid cancer incidence rates are 3-fold higher in women than in men (21 vs 7 per 100,000 population), despite equivalent death rates (0.5 per 100,000 population), largely reflecting sex differences in the “epidemic of diagnosis.” Over the past decade of available data, the overall cancer incidence rate (2004-2013) was stable in women and declined by approximately 2% annually in men, while the cancer death rate (2005-2014) declined by about 1.5% annually in both men and women. From 1991 to 2014, the overall cancer death rate dropped 25%, translating to approximately 2,143,200 fewer cancer deaths than would have been expected if death rates had remained at their peak. Although the cancer death rate was 15% higher in blacks than in whites in 2014, increasing access to care as a result of the Patient Protection and Affordable Care Act may expedite the narrowing racial gap; from 2010 to 2015, the proportion of blacks who were uninsured halved, from 21% to 11%, as it did for Hispanics (31% to 16%). Gains in coverage for traditionally underserved Americans will facilitate the broader application of existing cancer control knowledge across every segment of the population.
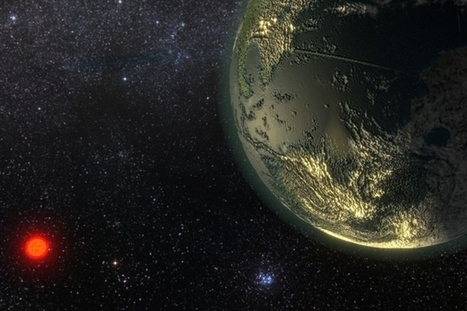
Members of the public can search a newly released database of 1,600 stars to find signs of undiscovered exoplanets. The dataset, taken over two decades by the W.M. Keck Observatory in Hawaii, comes with an open-source software package and an online tutorial. The search for planets beyond our solar system is about to gain some new recruits. Just recently, a team that includes MIT and is led by the Carnegie Institution for Science has released the largest collection of observations made with a technique called radial velocity, to be used for hunting exoplanets. The huge dataset, taken over two decades by the W.M. Keck Observatory in Hawaii, is now available to the public, along with an open-source software package to process the data and an online tutorial. By making the data public and user-friendly, the scientists hope to draw fresh eyes to the observations, which encompass almost 61,000 measurements of more than 1,600 nearby stars. “This is an amazing catalog, and we realized there just aren’t enough of us on the team to be doing as much science as could come out of this dataset,” says Jennifer Burt, a Torres Postdoctoral Fellow in MIT’s Kavli Institute for Astrophysics and Space Research. “We’re trying to shift toward a more community-oriented idea of how we should do science, so that others can access the data and see something interesting.” Burt and her colleagues have outlined some details of the newly available dataset in a paper to appear in The Astronomical Journal. After taking a look through the data themselves, the researchers have detected over 100 potential exoplanets, including one orbiting GJ 411, the fourth-closest star to our solar system. “There seems to be no shortage of exoplanets,” Burt says. “There are a ton of them out there, and there is ton of science to be done.”
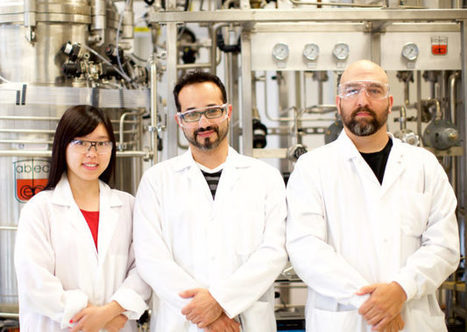
Modern experiment methods in biology can generate overwhelming amounts of raw data. To manage this, scientists must create entirely new workflows and systems capable of merging large, disparate data sets and presenting them intuitively. Arrowland is a combined -omics visualization tool that runs on a web browser, tablet, or cellphone. It shows functional genomics data (fluxomics, metabolomics, proteomics and transcriptomics) together on a zoomable, searchable map, similar to the street maps used for navigation. In addition to providing a coherent layout for -omics measurements, the maps in Arrowland are also an easy-to-use reference for the relationships between the reactions, genes, and proteins involved in metabolism. “At JBEI we have leveraged the insights provided by metabolic fluxes measured through 13C Metabolic Flux Analysis to make quantitative predictions for E. coli, and we shared these fluxes on Arrowland” said Hector Garcia Martin, Director of Quantitative Metabolic Modeling at JBEI. “By making this cloud-based interactive tool publicly available, our hope is to enable application of this tool in a wide range of fields, not only bioenergy. We are open to collaborations with the broader scientific community and industry.” Setting itself apart from other available tools, Arrowland is beneficial for its clarity and ease of use. With its unique interface and presentation method, Arrowland makes the exploration of -omics data as intuitive as possible, on a platform that does not require special hardware or configuration. Four different types of -omics data are integrated into the same map – an ability that no competing visualization platforms share – making important correlations and progressions easy to recognize and examine. Arrowland is open-source and currently under active development, with plans to add more maps, editing and curation features, and is integrated with an open-source modeling package that JBEI plans to release separately, called the JBEI Quantitative Metabolic Modeling Library. For the time being, a sample data set from the flux profiles published in “A Method to Constrain Genome-Scale Models with 13C Labeling Data”, PLOS Computational Biology (Garcia Martin et al, 2015) can be viewed at http://public-arrowland.jbei.org.
IBM recently announced a new IBM Watson Data Platform that combines the world’s fastest data ingestion engine touting speeds up to 100+GB/second with cloud data source, data science, and cognitive API services. IBM is also making IBM Watson Machine Learning Service more intuitive with a self-service interface. According to Bob Picciano, Senior Vice President of IBM Analytics “Watson Data Platform applies cognitive assistance for creating machine learning models, making it far faster to get from data to insight. It also, provides one place to access machine learning services and languages, so that anyone, from an app developer to the Chief Data Officer, can collaborate seamlessly to make sense of data, ask better questions, and more effectively operationalize insight.” For more information or a free trial of IBM Watson Data Platform, Data Science Experience, Watson APIs, or Bluemix, the following resources are useful:
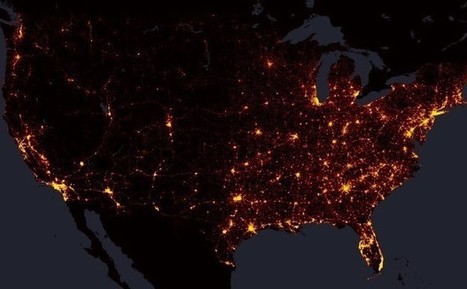
The death toll amounts to 373,377 lost lives. Max Galka of Metrocosm has made some lovely maps in 2015—tracking everything from obesity trends to property values to UFO sightings—but his latest effort may be the most powerful yet. Using data from the federal Fatality Analysis Reporting System, Galka maps every single U.S. road fatality from 2004 to 2013. The death toll amounts to 373,377 lost lives. At the national level, Galka’s map almost looks like an electricity grid stretching across America’s road network—with bright orange clusters in metro areas connected via dim red threads across remote regions. Here’s a wide view of the whole country:
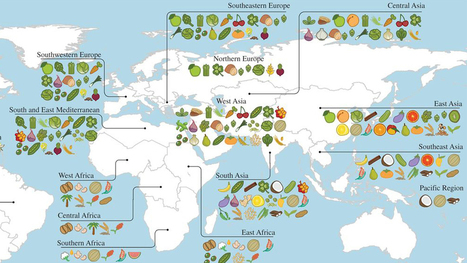
A new study reveals the full extent of globalization in our food supply. More than two-thirds of the crops that underpin national diets originally came from somewhere else — often far away. Previous work by the same authors had shown that national diets have adopted new crops and become more and more globally alike in recent decades. The new study shows that those crops are mainly foreign. The idea that crop plants have centers of origin, where they were originally domesticated, goes back to the 1920s and the great Russian plant explorer Nikolai Vavilov. He reasoned that the region where a crop had been domesticated would be marked by the greatest diversity of that crop, because farmers there would have been selecting different types for the longest time. Diversity, along with the presence of that crop's wild relatives, marked the center of origin. The Fertile Crescent, with its profusion of wild grasses related to wheat and barley, is the primary center of diversity for those cereals. Thai chilies come originally from Central America and tropical South America, while Italian tomatoes come from the Andes. Khoury and his colleagues extended Vavilov's methods to look for the origins of 151 different crops across 23 geographical regions. They then examined national statistics for diet and food production in 177 countries, covering 98.5 percent of the world's population.
Via DrDids, Neil Bombardier, Fernando Gil
|


