Al calor del Caribe
166.0K views | +0 today
Al calor del Caribe
Entre lo ecléctico y lo entrópico. Un espacio híbrido donde el desorden es una forma de orden
Curated by Minerva Bueno
Your new post is loading...
Rescooped by Minerva Bueno from Content Creation, Curation, Management
Scoop.it!

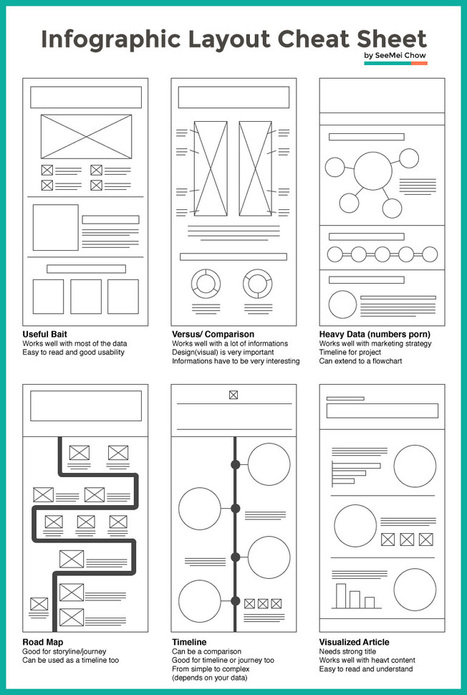
Layout Cheat Sheet for Infographics : Visual arrangement tips

Layout Cheat Sheet for Infographics : Visual arrangement tips | Al calor del Caribe | Scoop.it

Infographic layouts refer to the arrangement of your visual elements and your content. When you begin working on a piece of infographic, you should have a story to tell hence, you will need to select a layout that best suits your story. Using the right layout will ensure good readability and convey your message well.


We have put together a cheat sheet for your quick reference to the right arrangement to use, here are six common ones you can quickly work with....


Via Jeff Domansky, Kelly Pickering, Gust MEES, massimo facchinetti
Tony Guzman's curator insight, March 2, 2015 3:29 PM

This article helps you determine the best layout for the type of infographic you may be creating.

David Baker's curator insight, March 13, 2015 1:21 AM

This is a great tool to share with my seminar teachers whose final project for the year is an infographic.

Monica S Mcfeeters's curator insight, March 20, 2015 11:51 PM

HERE ARE SOME HELPFUL LAYOUTS TO SPEED UP YOUR DESIGNS.

Rescooped by Minerva Bueno from SOCIAL MEDIA INTERACTION (bilingual)
Scoop.it!

Visualize Your Data in the Age of Distraction For These 6 Reasons [Infographic]

Visualize Your Data in the Age of Distraction For These 6 Reasons [Infographic] | Al calor del Caribe | Scoop.it

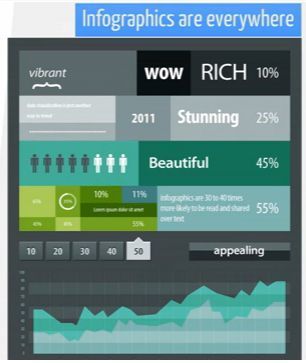
This piece was posted by Loren Sorenson for Hubspot, I selected it because as she says "If you aren’t prepared for the visual content revolution, you may be left in the dust.


Not convinced? Let's take a look at exactly how visual contentis positively contributing to marketing strategies -- it may just give you the push you need


"Learn why visual content is a critical part of your content creation strategy.


Here are some highlights:


**People remember only 20% of what they read


**83% of learning is visual


Condenses and Explains Large Amounts of Information


**Today, there is too much information on the Internet you have about 3 seconds to catch someone’s eyes so they'll consume your information.


Gives Your Brand an Identity


**Visual content draws people in, letting viewers better understand your brand's identity


Drives User Engagement


**If you've ever read a book with a child, you probably know they find pictures more interesting than words; but are adults really that different?


Selected by Jan Gordon covering "Content Curation, Social Business and Beyond"


Read full article here: [http://bit.ly/Ifujbp]


Via janlgordon, Beth Kanter, Martin (Marty) Smith, Rose Marie DeSousa
janlgordon's comment, April 11, 2012 3:21 PM
Beth Kanter
Thank you for adding me to the wiki and for your kind words, it's greatly appreciated. Yes this is the conversation of the moment so to speak. I'm sure your presentation was amazing. Would love to hear it if you have a replay.
Beth Kanter's comment, April 11, 2012 10:08 PM
Jan: There's a link in the wiki to the live stream of the session - and a lot of notes and resources ... I love this topic! I'm holding myself back from created another scoop.it on it ...
janlgordon's comment, April 13, 2012 10:05 PM
Beth Kanter
Thanks for looking forward to seeing this info. Knowing you, I can imagine that you want to start another scoopit on this topic but it's not necessary because you're already doing a wonderful job covering it now.
Rescooped by Minerva Bueno from 21st Century Tools for Teaching-People and Learners
Scoop.it!

How to Make Your Own Infographics

How to Make Your Own Infographics | Al calor del Caribe | Scoop.it
Website provides 10 tools for educators to make shareable online graphs and diagrams.


Read more:

http://www.edtechmagazine.com/k12/article/2012/08/how-make-your-own-infographics


Via Gust MEES
No comment yet.
Rescooped by Minerva Bueno from Digital Presentations in Education
Scoop.it!

easel.ly | create and share visual ideas online

easel.ly | create and share visual ideas online | Al calor del Caribe | Scoop.it

Watch the video tutorial, use vhemes (visual themes) to create your infographic - drag and drop a vheme onto your canvas for easy creation of your visual idea.


Via Baiba Svenca
No comment yet.
Rescooped by Minerva Bueno from Digital Presentations in Education
Scoop.it!

5 Great Online Tools for Creating Infographics

5 Great Online Tools for Creating Infographics | Al calor del Caribe | Scoop.it

Professional infographic designers rely primarily on a core vector graphics software program to create their infographics designs. The main advantage is that all the icons, charts, images, illustrations, and data visualizations are treated as separate objects that can be easily moved, resized, overlapped, and rotated. 


Via Baiba Svenca
Melissa Marshall's curator insight, October 15, 2014 12:56 AM

These tools are mostly web-based and provide ways in which students can visually represent their ideas. 

Stephan Hughes's curator insight, October 21, 2014 9:27 AM

Getting students to create infographics and using them ourselves to present information are more than justifiable reasons for these kind of tools

Isabelle Heymans's curator insight, November 8, 2014 4:43 AM

ajouter votre point de vue ...

Rescooped by Minerva Bueno from The Information Professional
Scoop.it!

10 Fun Tools To Easily Make Your Own Infographics

10 Fun Tools To Easily Make Your Own Infographics | Al calor del Caribe | Scoop.it

Posted by Katie Lepi:

"People love to learn by examining visual representations of data. That's been proven time and time again by the popularity of both infographics and Pinterest. So what if you could make your own infographics?"


Via Karen du Toit
No comment yet.
Rescooped by Minerva Bueno from Digital Presentations in Education
Scoop.it!

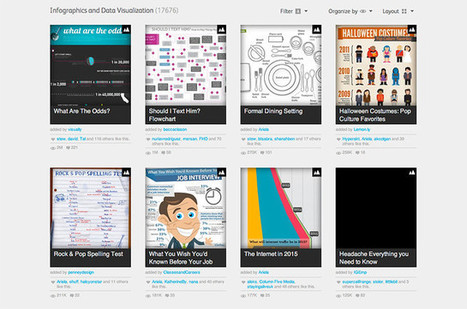
With Visual.ly Redesign, It’s Easier Than Ever To Make And Share Cool Infographics

With Visual.ly Redesign, It’s Easier Than Ever To Make And Share Cool Infographics | Al calor del Caribe | Scoop.it

What could be better than a free site that lets you upload or build your own sexy-looking infographics? A free site that lets you do all that, while helping you connect with like-minded data enthusiasts and potential clients.

Suggested by Alfredo Corell.


Via Baiba Svenca
No comment yet.