 Your new post is loading...

|
Scooped by
Jeff Domansky
October 2, 2014 10:28 AM
|
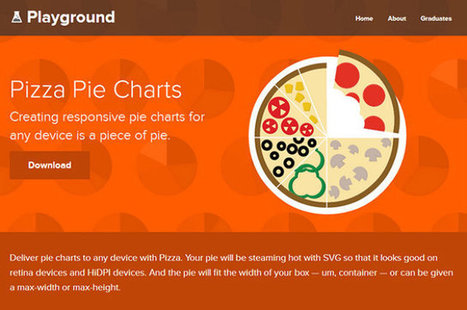
Easel.ly is an online tool for creating infographics. I've reviewed a couple of times in the past on this blog. The latest update to Easelly introduced a tool for creating charts to incorporate into your infographics. The chart creation tool is a drag-and-drop option that can be found in the Easelly toolbar.
Easel.ly provides a canvas on which you can build your own infographic by dragging and dropping pre-made design elements. You can use a blank canvas or build upon one of Easel.ly's themes. In addition to using the built-in creation tools you can upload your own graphics to include in your infographic. Your completed infographic can be exported and saved as PNG, JPG, PDG, and SVG files....
|
|
Scooped by
Jeff Domansky
September 15, 2014 11:36 PM
|
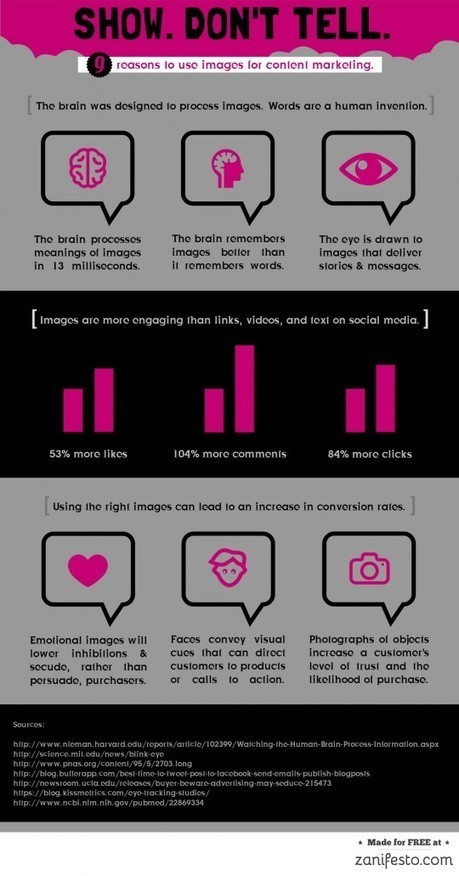
Visual social media posts get more engagement than text, but this rule goes for all content marketing pieces.
|
|
Scooped by
Jeff Domansky
August 23, 2014 1:38 AM
|
Visual content is taking the web by storm. Infographics. Motion graphics. Micro-content. It’s hard to keep track of it all.
I’m here to talk about interactive graphics – the cool new kids on the block when it comes to visual content – and why they’re the next big thing incontent marketing....
|
|
Scooped by
Jeff Domansky
August 19, 2014 10:55 AM
|
...Animated videos, on the other hand, provide a quick way to create super HD quality video content that has several advantages over traditional video. It has none of the artificial and cringe-worthy acting and no issues with sound or weather, particularly when filming outdoors!
All you need to do is apply this approach to infographics. As with animated videos, you don’t need any specialist design or video production expertise to create one. And while you’re able to create excellent visual feasts that require little effort from the viewer to learn from them (all they need to do is hit “play”!), you’re also taking advantage of the popularity of videos.
Let’s take a look at one of our favourite tools of the moment – GoAnimate. Hosted online, all you need is an Internet connection to produce professional-looking animated videos....
|
|
Scooped by
Jeff Domansky
August 11, 2014 2:28 AM
|
Finding the newest way to get you brand in front of an audience these days can be challenging. There’s tons of brands utilizing different marketing efforts to get their product in front of potential customers.
There’s blog posts, infographics, videos, and more.However, there’s a new player in town, and it’s an online interactive. Brands are jumping on the interactive bandwagon, and honestly, some of the stuff that’s being put out there is amazing!
What are Interactives?
Essentially at the end of the day, an interactive is pretty much an infographic that you can interact with. Interactives are the most effective method of displaying limitless chunks of data or information in a clean, correlated, and engaging format....
|
|
Scooped by
Jeff Domansky
May 29, 2014 10:49 PM
|
The world complained of infographic fatigue two years ago.
Yet, infographics continue to be a mainstay of visual storytelling. Fresh infographics – when I say “fresh,” I mean a narrative that’s easy on the eyes, entertaining, and delivers a surprise – still generate attention. When we look across our client blogs, the posts with infographics inevitably score well in the popularity index called Google Analytics.
That’s the good news.
On the not-so-good side, the popularity of infographics has resulted in some visuals that can only be described as dreadful (to be kind). The infographic platform by itself doesn’t automatically serve the target audience. You still need to deliver information that has relevance to the reader and offers something that they will care about....
|
|
Scooped by
Jeff Domansky
May 23, 2014 3:36 AM
|
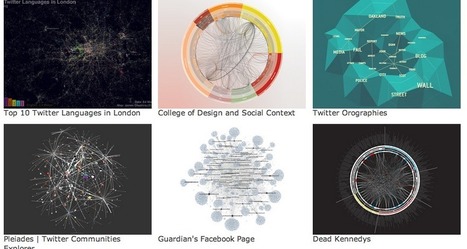
Every designer knows the problem: where to look for inspiration and new forms of visualization? As available data and visualization tools evolve, this question is becoming increasingly relevant for data journalists as well. Shall we choose a bar chart or a map? What are the best practices out there? Who has done what already? These five data visualization catalogs feature and categorize the best projects out there...
|
|
Rescooped by
Jeff Domansky
from visualizing social media
September 1, 2014 11:33 PM
|
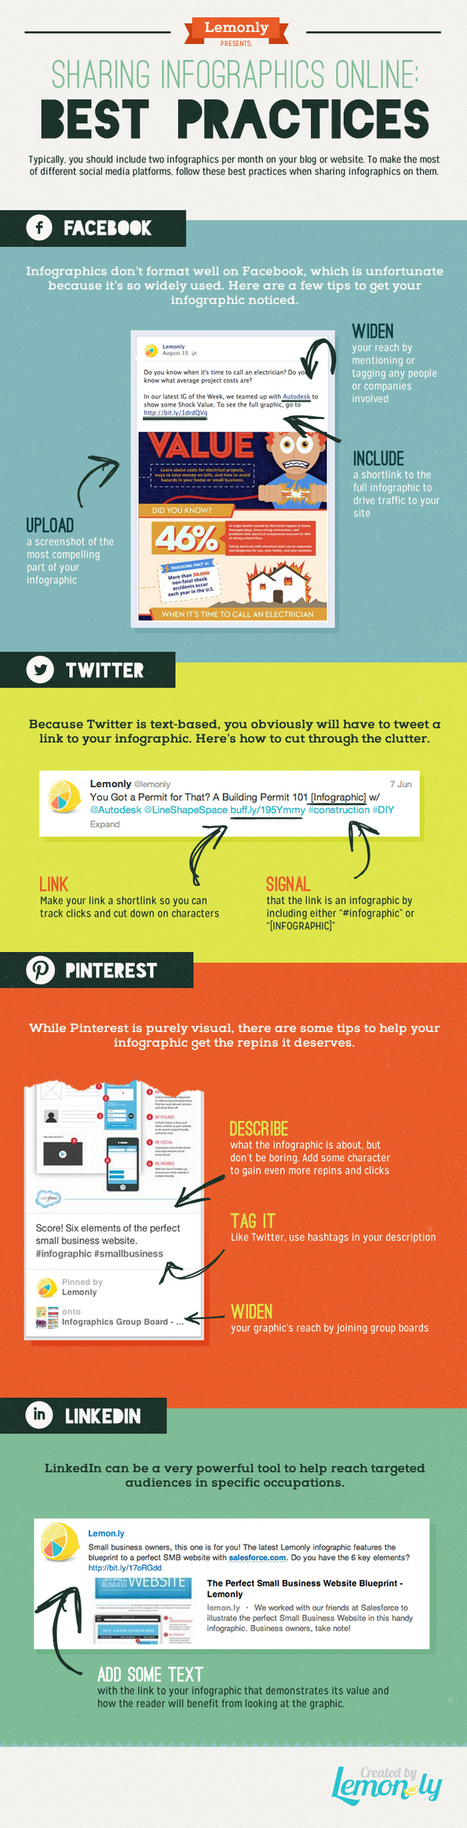
Sharing your infographic that’s hosted on your website/blog and engaging the social sharing potential is key to maximizing the work you put in to creating your infographics. Each social network has different image display requirements. For example, tall infographics do not present well on Facebook. Facebook outlines horizontal images and a ratio of 1200 w x 627 h, meaning you may need to create some sharing images to drive social viewers to the main infographic.
The team at Lemonly put together a great infographic covering keys for social sharing on: - Facebook
- Twitter
- Pinterest
- LinkedIn
Have a look and bookmark for future reference...
Via Lauren Moss
|
|
Scooped by
Jeff Domansky
May 14, 2014 2:49 AM
|
What are the current trends with infographics in 2014?
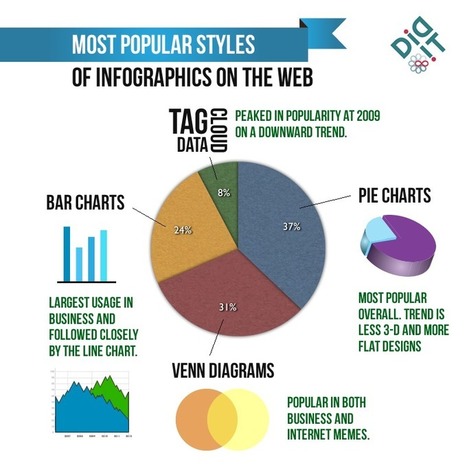
Infographics have always been around, but the emergence of “Big Data” has caused the display of trends and statistical correlations using “little men” and 3-D pie charts to become more popular than ever. Why? As a society we’ve become inundated with piles of alphanumeric data each day.
Infographics takes this content and boils it down to essential, understandable visual elements. Additionally, as a content building/content marketing tactic, infographics can provide a break from “dry text,” causing users to spend more time on the page. But as the novelty of infographics has faded, more and more bad infographics saturate the web landscape.
In order for infographics to be effective, they need to use multiple data points to tell a cohesive story or prove a theory. After some research, I found some interesting trends affecting the infographics space....
|
|
Scooped by
Jeff Domansky
May 7, 2014 11:00 PM
|
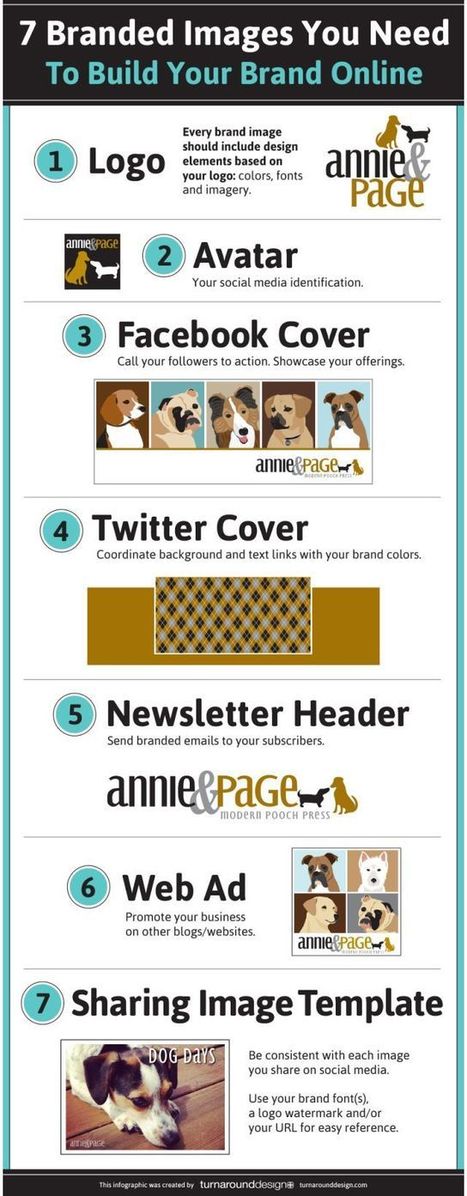
Building your brand online takes work. Every image that you associate your business with needs to represent your brand in some way. You certainly don’t want to cut corners in this area. This infographic by Turn Around Design covers 7 images you need to build your brand online:
|
|
Scooped by
Jeff Domansky
April 17, 2014 1:47 PM
|
There have never been more technologies available to collect, examine, and render data. Here are 30 different notable pieces of data visualization software good for any designer's repertoire. They're not just powerful; they're easy to use. In fact, most of these tools feature simple, point-and-click interfaces, and don’t require that you possess any particular coding knowledge or invest in any significant training. Let the software do the hard work for you. Your client will never know.....
|
|
Scooped by
Jeff Domansky
April 12, 2014 7:28 PM
|
From scotch to bourbon, this chart categorizes all the types of whiskey.
|
|
Scooped by
Jeff Domansky
March 16, 2014 11:10 PM
|
The team decided on an interactive infographic (or what we coined as an “Interac-phic”) to gain mindshare through social media platforms. Seeing how SG travellers are increasingly travel-savvy, we sensed an opportunity to allow users to explore the app and discover these travel trends for themselves.
Expedia loved our idea and energy. Furthermore, after witnessing our creative sensibilities, they gave us the freedom to play pilot in the Expedia cockpit and deliver beyond what was initially expected. After expanding the concept, Expedia saw what could be achieved and were behind us all the way. We got cracking on the project with a programming resource, and the “The Anatomy of the Digital Traveller” campaign was launched in December 2013....
|
|
|
Scooped by
Jeff Domansky
September 26, 2014 10:06 AM
|
Are you ready to use infographics in your social media marketing?
Do you know how to get started?
Creating infographics is getting easier. When you illustrate a concept with images, you’re likely to find a bump in social media visibility.
In this article you’ll discover how to create and promote infographics to put your content front and center....
|
|
Scooped by
Jeff Domansky
September 3, 2014 7:58 PM
|
They used to say content is king. But what really makes up content? Gone are the days when “content” meant purely text. Today, if you want to engage and enchant your customers, your content must have some visual cues. The human brain processes visual information much quicker than text. And with web 2.0 visuals like infographics, you can convey complex, boring data in a meaningful manner. Although infographics make things simpler, it can be time-consuming to create them. Here is a list of my top 10 tools to create your own beautiful infographics and more visual content (no Photoshop required!).
|
|
Scooped by
Jeff Domansky
August 20, 2014 10:30 PM
|
...The only problem is, infographics that look like they were simple to make are often anything but. Creating something beautiful and instantly understandable in Photoshop is often beyond the limits that time allows. Which is why it's occasionally useful to use a quick and dirty infographics tool to speed up the process.
We've selected our favourites here. They're all free, or offer free versions. Let us know which ones you get on best with...
|
|
Scooped by
Jeff Domansky
August 19, 2014 12:02 AM
|
I used to be a big fan of leveraging infographics to grow my traffic and brand. Why? Because it used to provide exceptional results.
The results were so great that when we started releasing infographics on the KISSmetrics blog in 2010, it helped us generate2,512,596 visitors and 41,142 backlinks.
Based on the KISSmetrics stats from 2010, we know infographics worked well then. But the real question is: do they still work today? Over the years, I’ve created 218 infographics, so let’s analyze the data to see what we can glean from these numbers:...
|
|
Scooped by
Jeff Domansky
June 9, 2014 7:46 PM
|
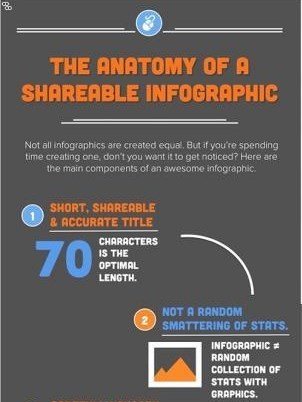
Make sure your infographics don't fall flat. Learn what essential elements you need to increasing sharing.
Luckily, there are few things we can do to infographics to hedge our bets a bit. So, we put together the following infographic on making highly shareable infographics -- helping you rake in more views and conversion opportunities. Follow these tips, and your infographic will be much more likely to get shared.
|
|
Scooped by
Jeff Domansky
May 23, 2014 1:42 PM
|
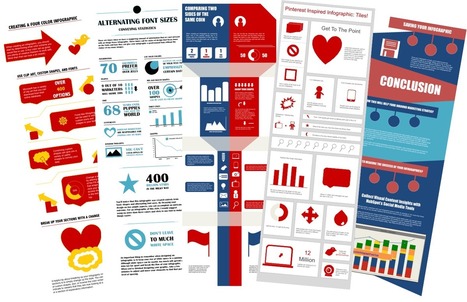
When most marketers hear the term "visual content," the first type that comes to mind is usually the infographic. But how can those who don't necessarily have a design background -- or budget to commission an agency, hire a dedicated in-house designer, or purchase expensive design software -- create professional-looking infographics that enable them to leverage the power of visual content?
We're so glad you asked! Here's a little secret: You can do it right within software you likely already have loaded on your computer. That's right! PowerPoint can be your best friend when it comes to visual content creation. And to help you get started, we've created five fabulous infographic templates you can download for free and use to customize your own infographics right within PowerPoint -- as well as some helpful tips and tricks to help you learn how to use PowerPoint to its full potential.
Sprites is a free tool for creating beautiful animated infographics for the Web.
Via Ana Cristina Pratas
|
|
Scooped by
Jeff Domansky
May 16, 2014 1:00 AM
|
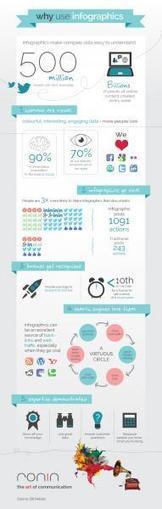
The age of big data is here. Over the course of a week, billions of pieces of content are created and spread all over the web. Indeed, on average, 500 million tweets are sent everyday.
Yet, we have increasingly less time to absorb this data. Enter the infographic. Simple, attractive, fun; infographics make often incredibly detailed research and statistics easy to digest. Packed with charts, graphs, maps, icons, they are visual shorthand, if you will.
The popularity of the infographic has certainly rocketed in recent times. Here’s why and, moreover, why you should be using them....
|
|
Scooped by
Jeff Domansky
May 12, 2014 11:16 AM
|
Make sure your infographics don't fall flat. Learn what essential elements you need to increasing sharing.
Luckily, there are few things we can do to infographics to hedge our bets a bit. So, we put together the following infographic on making highly shareable infographics -- helping you rake in more views and conversion opportunities. Follow these tips, and your infographic will be much more likely to get shared....
|
|
Scooped by
Jeff Domansky
May 5, 2014 9:41 AM
|
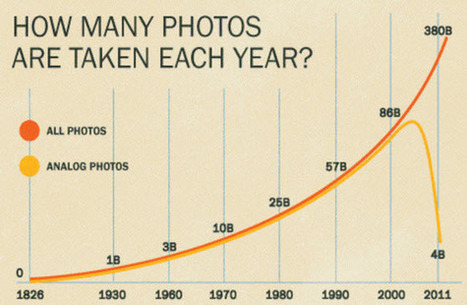
Gradually, then suddenly.” That’s how Hemingway described the ill fortune of a bankrupt in The Sun also Rises. It should probably be required reading for any incumbent in a digitally disruptable market. But who has time to read a book these days — or even a Kindle? Instead, here are three charts that tell a compelling story with an inescapable conclusion.
Chart One plots the decline of analog photographs (and the film manufacturing industry they sustained). In the year 2000 — at the very height of dotcom 1.0 hysteria — over 80 billion analogue photographs were taken around the world....
|
|
Scooped by
Jeff Domansky
April 12, 2014 9:14 PM
|
Although they have come under some scrutiny in recent years, done well they are an extremely useful way of presenting data in a cohesive way that allows you to easily compare and contrast key findings. With good creative work, they can also be a really attractive piece of marketing communication.
When pulling your data together for an infographic, you must focus on a topic that is engaging to your target audience. However, once you have all the data, have created a beautiful image, and have it all set to go, you’ll want to maximize its effectiveness, so here are our top seven tips for doing just that:...
|
|
Scooped by
Jeff Domansky
March 27, 2014 9:47 AM
|
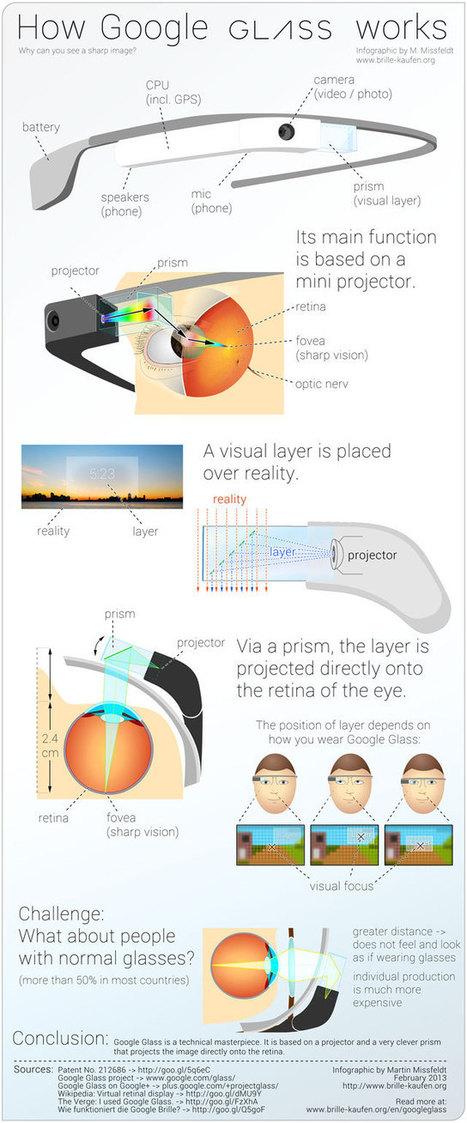
The Google Glass phenomenon has gotten a ton of coverage from the tech press, but how does it work? Creator Martin Missfeldt explains the inner workings in his How Google Glass Works infographic.
|






























Very useful addition to a useful infographics tool.