
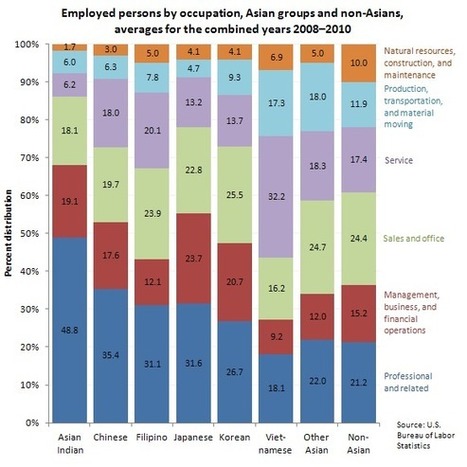

The Editor's Desk: U.S.Bureau of Labor Statistics...
Ethnic geography, migration and economic geography intersect in this compelling infographic.
Get Started for FREE
Sign up with Facebook Sign up with X
I don't have a Facebook or a X account


 Your new post is loading...
 Your new post is loading...
Your new post is loading...
The Editor's Desk: U.S.Bureau of Labor Statistics...
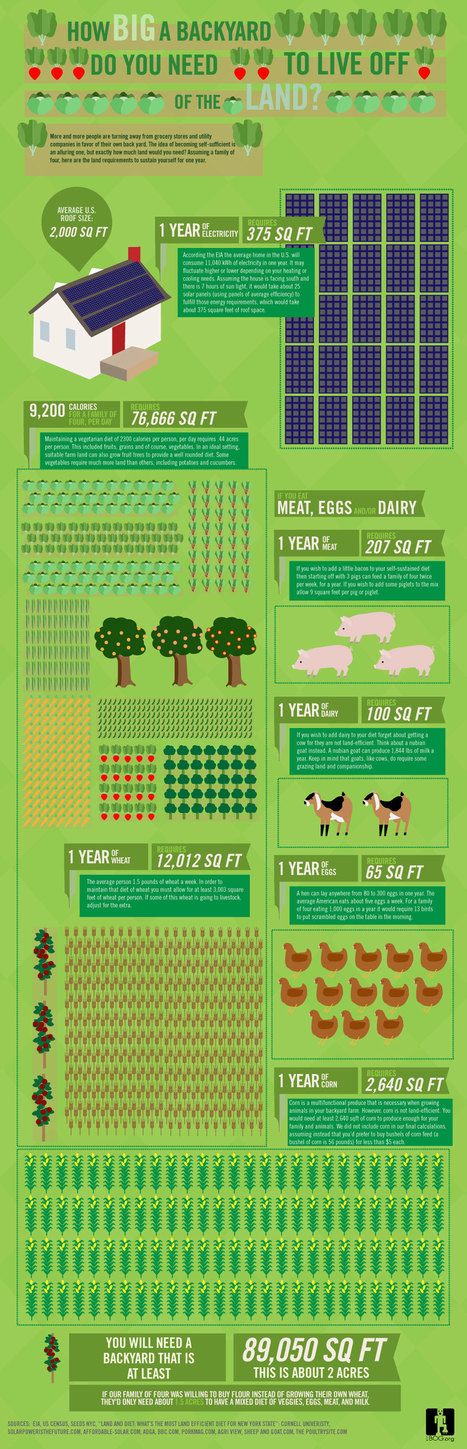
Ethnic geography, migration and economic geography intersect in this compelling infographic. 
Tags: infographic, food, agriculture, sustainability, urban, urban ecology, locavore, land use, unit 5 agriculture, unit 7 cities. Via Mark Slusher, Steve Perkins

Courtney Holbert's curator insight,
February 3, 2013 10:44 PM
Good visual representation of what it would take to be self sufficient. 
Chris Scott's curator insight,
July 14, 2013 9:51 AM
If you need a backyard that is about 2 acres to live off the land imagine how big of a backyard you would need if you had a family of 8. |

A GOOD Transparency....
This simple graphic shows the uneven effects of development based on demographic factors such as gender and age.
|


This chart shows the labor force from 2008 to 2010. It what kind of races were active in the labor force and the percentage the race made up of the labor force. It also shows what kind of work they did and how much of the percentage of that race was involved in a specific line of work.
Migration refers to the movement of people across borders. This graph/article illustrates the large amount of Asians migrating to the United States, and joining the work force. The graph further breaks down the "Asians" by specific origin and ethnicity, showing that Chinese Asians are the most prominent in the US workforce.