

A promo piece (2:26) for my ISTE11 Presentation "A Picture is Worth 1000 Words: Infographics as a Creative Assessment". Royalty free music from Soundzabound.com…

|
Suggested by Learning Futures |

Get Started for FREE
Sign up with Facebook Sign up with X
I don't have a Facebook or a X account


 Your new post is loading...
 Your new post is loading...
Your new post is loading...
A promo piece (2:26) for my ISTE11 Presentation "A Picture is Worth 1000 Words: Infographics as a Creative Assessment". Royalty free music from Soundzabound.com…
|
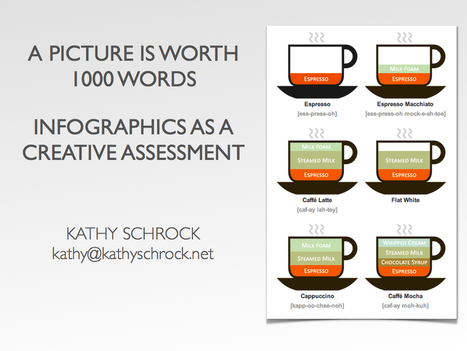
Infographics are a visual representation of data. When students create infographics, they are using information, visual, and technology literacies. This page includes links to help you develop formative or summative assessments that have students creating infographics to showcase their mastery of knowledge.

Paula King, Ph.D.'s curator insight,
December 5, 2014 2:24 PM
I agree that infographics can convey a lot; I need to learn to make them. |


I love the idea of students creating infographics for presenting work and this short video illustrates the many contexts where this method could be really effective.
Vídeo-resumen de la ponencia de Kathy Schorck "A Picture is Worth 1000 Words: Infographics as a Creative Assessment" (Una imagen vale más que 1000 palabras: Infografía como una evaluación creativa).