

Jupyter Notebook is a powerful tool for data analysis. Here is a collection of 28 tips, tricks, and shortcuts to turn you into a Jupyter power user!
Get Started for FREE
Sign up with Facebook Sign up with X
I don't have a Facebook or a X account


 Your new post is loading...
 Your new post is loading...
Your new post is loading...
Jupyter Notebook is a powerful tool for data analysis. Here is a collection of 28 tips, tricks, and shortcuts to turn you into a Jupyter power user! 
No comment yet.
Sign up to comment

This article details how to use a Python virtual environment to manage your Python projects.
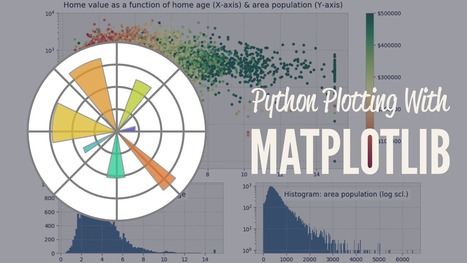
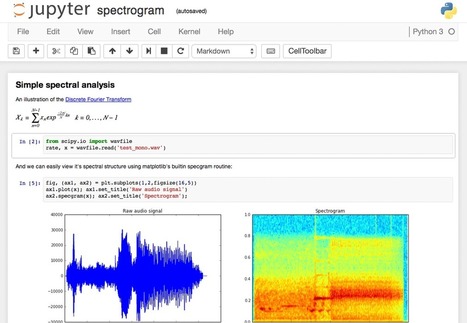
This article is a beginner-to-intermediate-level walkthrough on Python and matplotlib that mixes theory with examples.
A picture says a thousand words, and with Python’s matplotlib library, it fortunately takes far less than a thousand words of code to create a production-quality graphic.
However, matplotlib is also a massive library, and getting a plot to look “just right” is often practiced on a trial-and-error basis. Using one-liners to generate basic plots in matplotlib is fairly simple, but skillfully commanding the remaining 98% of the library can be daunting.
This guide is a beginner-to-intermediate-level walkthrough on matplotlib that mixes theory with example. While learning by example can be tremendously insightful, it helps to have even a surface-level understanding of the library’s inner workings and layout as well.
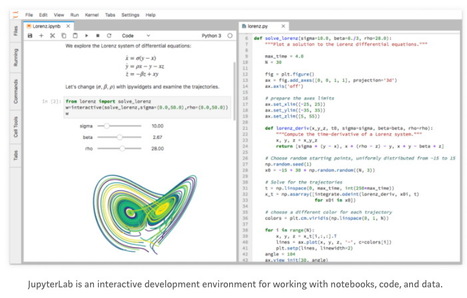
Recent beta release of JupyterLab embodies the meta-theme of extensible software architecture for interactive computing with data. While many people think of Jupyter as a “notebook,” that’s merely one building block needed for interactive computing with data. Other building blocks include terminals, file browsers, LaTeX, markdown, rich outputs, text editors, and renderers/viewers for different data formats. JupyterLab is the next-generation user interface for Project Jupyter, and provides these different building blocks in a flexible, configurable, customizable environment. This opens the door for Jupyter users to build custom workflows, and also for organizations to extend JupyterLab with their own custom functionality.
Thousands of organizations require data infrastructure for reporting, sharing data insights, reproducing results of analytics, etc. Recent business studies estimate that more than half of all companies globally are precluded from adopting AI technologies due to a lack of digital infrastructure — often because their efforts toward data and reporting infrastructure are buried in technical debt. So much of that infrastructure was built from scratch, even when organizations needed essentially the same building blocks. JupyterLab’s primary goal is to make it routine to build highly customized, interactive computing platforms, while supporting more than 90 different popular programming environments.
A major theme builds on top of the other two: computational communication. For data and code to be useful for humans, who need to make decisions, it has to be embedded into a narrative — a story — that that can be communicated to others. Examples of this pattern include: data journalism, reproducible research and open science, computational narratives, open data in society and government, citizen science, and really any area of scientific research (physics, zoology, chemistry, astronomy, etc.), plus the range of economics, finance, and econometric forecasting. Another growing segment of use cases involves Jupyter as a “last-mile” layer for leveraging AI resources in the cloud. This becomes especially important in light of new hardware emerging for AI needs, vying with competing demand from online gaming, virtual reality, cryptocurrency mining, etc.
Take the following as personal opinion, observations, perspectives: We’ve reached a point where hardware appears to be evolving more rapidly than software, while software appears to be evolving more rapidly than effective process. O’Reilly Media work to map the emerging themes in industry, in a process nicknamed “radar”. This perspective about hardware is a theme I’ve been mapping, and meanwhile comparing notes with industry experts. A few data points to consider: Jeff Dean’s talk at NIPS 2017, “Machine Learning for Systems and Systems for Machine Learning” about comparisons of CPUs/GPUs/TPUs, and how AI is transforming the design of computer hardware; The Case for Learned Index Structures, also from Google, about the impact of “branch vs. multiple” costs on decades of database theory; this podcast interview “Scaling machine learning” with Reza Zadeh about the critical importance of hardware/software interfaces in AI apps; the video interview that Wes McKinney and I recorded at JupyterCon 2017 about how Apache Arrow presents a much different take on how to leverage hardware and distributed resources.

This is the final and concluding part of my series on ‘Practical Machine Learning with R and Python’. Included are Machine Learning algorithms in R and Python. The algorithms implemented are:

A Django tutorial series for complete beginners. A comprehensive guide covering all the basic aspects of Django models, views, templates, testing, admin.
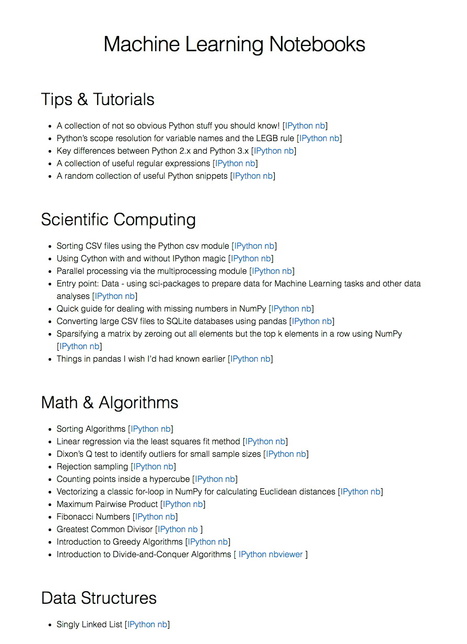
The 11 IPythonTutorials
For more articles about IPython for Data Science and Machine Learning, click here.
DataScience and Machine Learning Resources
Additional Reading
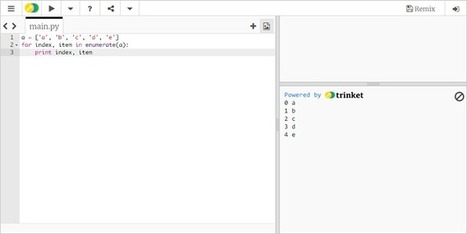
Whether you're going through these Python examples or reviewing the basics of arrays and lists, you can test the code right in your browser. Here are the best online Python interpreters we've found. Via Fernando Gil
This is the personal website of a data scientist and machine learning enthusiast with a big passion for Python and open source. Born and raised in Germany, now living in East Lansing, Michigan.
|
At their PyData Seattle talk on Jupyter Lab, the authors demonstrate opening a 1 trillion row by 1 trillion column csv (and effortlessly scrolling left and right across the columns), as well as realtime collaboration using the Jupyter Lab Google Drive extension, OOTB Vega and GeoJSON compatibility, and plenty of other incredible features.
In July 2017, the Design Lab at UC San Diego scraped and analyzed over 1 million Jupyter Notebooks from GitHub. They are making these data publicly available for everyone to explore! While only a snapshot of one corner of the Jupyter universe, these data provide unique perspective into how people use and share Jupyter Notebooks.
The collection includes over 1 million notebooks as well as metadata about the nearly 200,000 repositories where they lived. The full dataset is nearly 600GB so we have created a smaller 5GB sampler dataset for you to get started. This includes roughly 6,000 notebooks from 1000 repositories.
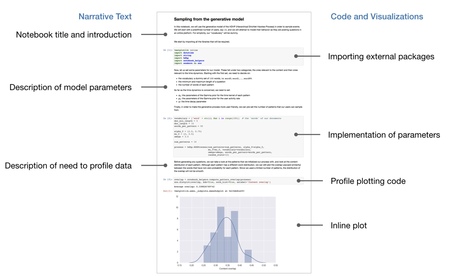
They originally collected these data to explore how people use narrative text in Jupyter Notebooks. The UCSD team found many notebooks, even those accompanying academic publications, had little in the way of descriptive text. This is likely because many analysts view their notebooks as personal and messy works-in-progress. On the other hand, many of the notebooks they collected were masterpieces of computational narrative, elegantly explaining complex analyses (one notebook even had more text than The Great Gatsby). The UCSD team members think this spread reflects a tension between data exploration, which tends to produce messy notebooks, and process explanation, in which analysts clean and organize their notebooks for a particular audience.
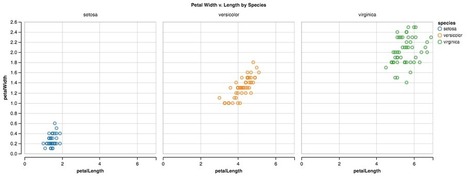
After creating the Free Wtr bot using Tweepy and Python and this code, the author wanted a way to see how Twitter users were perceiving the bot and what their sentiment was. So he created a simple data analysis program that takes a given number of tweets, analyzes them, and displays the data in a scatter plot.
In order to create this, you have to install a few packages, including Tweepy , Tkinter , Textblob and matplotlib . These packages can be installed using the pip package manager.

From
medium

Deep Learning frameworks such as Theano, Caffe, TensorFlow, Torch, MXNet and CNTK are the work horses of Deep Learning work. These frameworks as well as the GPU (predominantly Nvidia) are the what enables the rapid growth of Deep Learning. It was refreshing to hear Nando de Freitas acknowledge their work in the recently concluded NIPS 2016 conference. Infrastructure does not get enough of the recognition it deserves in the academic community. Yet, programmers toil on to continually tweak and improve their frameworks.
Recently, a new framework was revealed by Facebook and a bunch of other partners (Twitter * NVIDIA * SalesForce * ParisTech * CMU * Digital Reasoning * INRIA * ENS). PyTorch came out of stealth development. PyTorch is an improvement over the popular Torch framework (Torch was a favorite at DeepMind until TensorFlow came along). The obvious change is the support of Python over the less often used Lua language. Almost all of the more popular frameworks use Python, so it is a relief that Torch has finally joined the club.
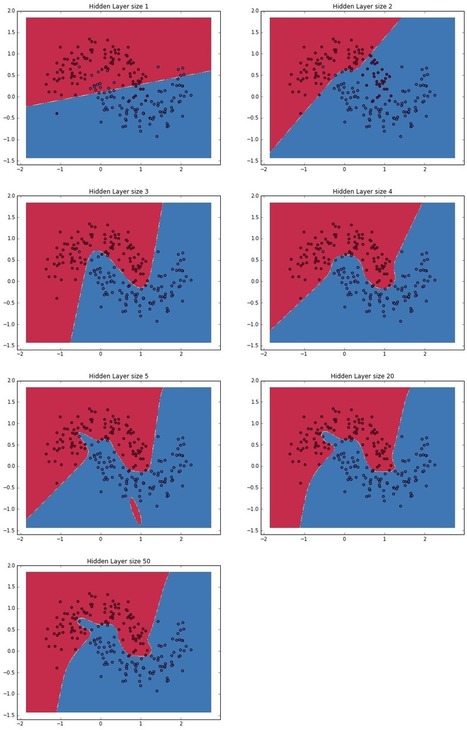
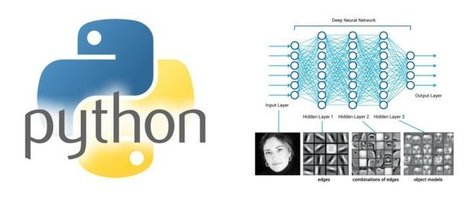
In this post we will implement a simple 3-layer neural network from scratch. We won’t derive all the math that’s required, but we will try to give an intuitive explanation of what we are doing.
Learners should be familiar with basic Calculus and Machine Learning concepts, e.g. know what a classification and a regularization is. Ideally students should also know a bit about how optimization techniques like gradient descent work. Via Eric Feuilleaubois
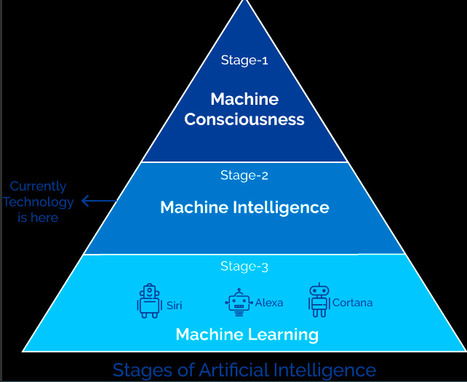
Deep learning is the most interesting and powerful machine learning technique. It is the root of the most enthralling and amazing features that we access today which covers a wide range of areas like robots, image recognition, NLP and artificial intelligence, text classification, text-to-speech and many more. It is also the technology behind widely used features provided by Facebook i.e. tagging each other in pictures or be Google's self-driving cars or speech recognition. Via Eric Feuilleaubois
This somewhat witty and detailed walkthrough will help you explore the difference between the major data visualization tools in the Python ecosystem — including some options that were ported from R!
From
hative
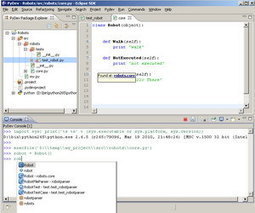
Python is an interpreted, object-oriented, high-level programming language with dynamic semantics. Using third-party tools, Python code can be packaged into standalone executable programs (such as Py2exe, or Pyinstaller). Python interpreters are available for many operating systems. Programmers often fall in love with Python because of the increased productivity it provides. Since there is no compilation step, the edit-test-debug cycle is incredibly fast.
If you are going to develop software using Python, please choose an Best Python IDE(Integrated Development Environment). In this page we have collected some really good Integrated Development Environments for Python, which provides you a convenient environment to code, edit, test, and debug applications written in Python. Let’s have a look on all of them, one by one.
A Jupyter Notebook is a web application that allows you to create and share documents that contain live code, equations, visualizations and explanatory text. Uses include: data cleaning and transformation, numerical simulation, statistical modeling, machine learning and much more.Click here to edit the content
![PyVideo.org · SciPy - 5 Years of Python Lectures and Tutorials [Videos] | Best | Scoop.it](https://img.scoop.it/UaKhFECfGUV8Y3wRR3Wyezl72eJkfbmt4t8yenImKBVvK0kTmF0xjctABnaLJIm9)
SciPy 2015, the fourteenth annual Scientific Computing with Python conference, will be held this July 6th-12th in Austin, Texas. SciPy is a community dedicated to the advancement of scientific computing through open source Python software for mathematics, science, and engineering. The annual SciPy Conference allows participants from all types of organizations to showcase their latest projects, learn from skilled users and developers, and collaborate on code development.
The full program will consist of two days of tutorials by followed by three days of presentations, and concludes with two days of developer sprints on projects of interest to attendees.
|


![66 machine learning lectures [2017-2018], including deep learning | Best | Scoop.it](https://img.scoop.it/bSlzDwk-XrhUYoqTh7ZUDjl72eJkfbmt4t8yenImKBVvK0kTmF0xjctABnaLJIm9)

