Your new post is loading...
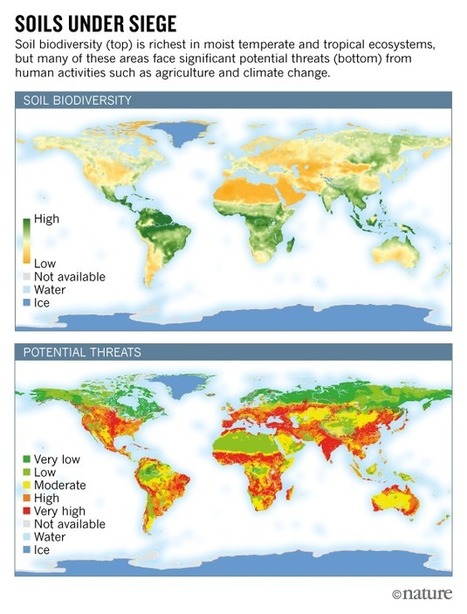
Diana Wall has built a career on overturning assumptions about underground ecosystems. Now she is seeking to protect this endangered world. What is soil biodiversity? How does it vary in space and time? What does it provide to society? What are the main threats to soil biodiversity? What can we do to preserve it? The first ever Global Soil Biodiversity Atlas uses informative texts, stunning photographs and striking maps to answer and explain these and other questions. There are many factors influencing the distribution of soil organisms, how soil biodiversity supports food production, the pressures affecting soil life and the possible interventions to preserve it. Soil is an extremely complex system resulting from the essential interactions between inert and living components. Soils host a myriad of soil organisms ranging in size from a few micrometers to several centimeters, from the microscopic bacteria and archaea to the "giant" earthworms and moles. All these organisms are distributed over space and time, and each ecosystem and season has its unique soil community. Soil organisms interact to provide essential ecosystem services to human beings and the environment, ranging from supporting plant growth to the regulation of climate. Soils are becoming increasingly under pressure and so are the organisms living in them. Intensive agriculture, loss of above ground biodiversity, soil erosion and land degradation are among the most relevant threats to soil life. We can protect soil creatures by taking specific actions. No-tillage, diversification of crops, increasing reforestation and greater use of natural amendments are examples of interventions that may promote life in soils. People need to know about the fascinating world below ground and understand its value.
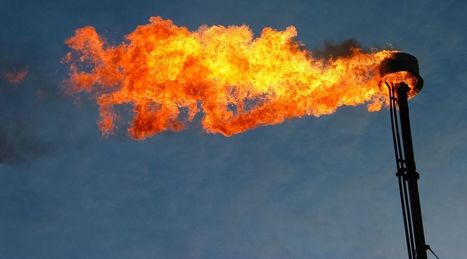
New research, led by the University of Southampton, suggests that the release of methane from the seafloor was much slower than previously thought during a rapid global warming event 56 million years ago. The study, published in the journal Geophysical Research Letters, could allow scientists to better understand the potential effects of rising ocean temperatures worldwide on current and future climate change.
During the Paleocene-Eocene Thermal Maximum (PETM), temperatures in the deep ocean rose by about five degrees Celsius and sea surface temperatures increased by up to nine degrees Celsius. This hot period lasted for about 100,000 years and caused the extinction of many species.
Based on evidence from tiny fossils deposited in sediments at the bottom of the ocean, which record information about the chemical composition of the ocean in their shells, current theories suggest that at the same time as the warming there was a massive release of methane gas from the solid earth into the ocean and atmosphere. A large proportion of the Earth’s methane is stored beneath the oceans in the form of an ice-like material called hydrate. This hydrate can melt if the ocean above warms, and melting of hydrate provides a widely accepted mechanism for the methane outburst.
Via Mariaschnee
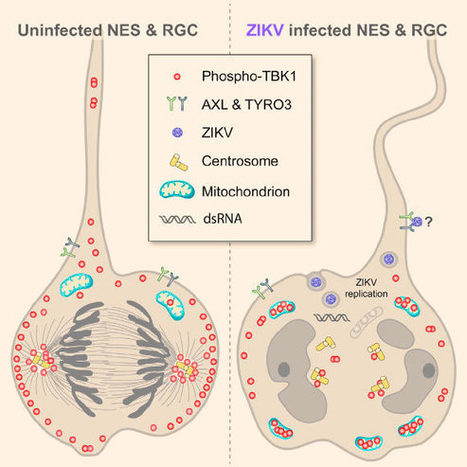
According to a team of researchers led by Yale University, infection by the Zika virus diverts a key protein necessary for neural cell division in the developing human fetus. Marco Onorati et al. describe the derivation and characterization, including single-cell RNA-seq, of neocortical and spinal cord neuroepithelial stem (NES) cells to model early human neurodevelopment and Zika virus (ZIKV)-related neuropathogenesis. By analyzing human NES cells, organotypic fetal brain slices, and a ZIKV-infected micrencephalic brain, the team shows that ZIKV infects both neocortical and spinal NES cells as well as their fetal homolog, radial glial cells (RGCs), causing disrupted mitoses, supernumerary centrosomes, structural disorganization, and cell death. ZIKV infection of NES cells and RGCs causes centrosomal depletion and mitochondrial sequestration of phospho-TBK1 during mitosis. The scientists also found that nucleoside analogs inhibit ZIKV replication in NES cells, protecting them from ZIKV-induced pTBK1 relocalization and cell death. They established a model system of human neural stem cells to reveal cellular and molecular mechanisms underlying neurodevelopmental defects associated with ZIKV infection and its potential treatment.
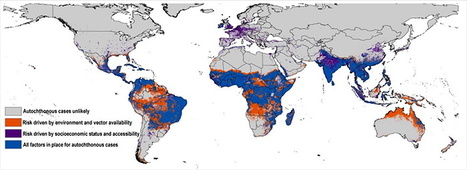
With Zika sparking anxiety at the Summer Olympic Games in Brazil, and now being transmitted in Florida through contact with mosquitoes, accurately mapping the distribution of the virus is increasingly urgent.
Accounting for a host of often-overlooked drivers of transmission, a team of University of Kansas researchers has mapped Zika risk around the world with unprecedented resolution while considering more factors than previous models.
The mapping effort uses ecological niche modeling, a technique used to predict distributions of species, to show the virus’ powerful ability to spread in South and Central America.
This study is the first to evaluate the risk of Zika virus transmission in Europe, which appears relatively low. Research suggests parts of the southern U.S., including parts of Florida, Texas and Louisiana, are vulnerable to transmission of the virus. “It’s the first detailed map that weighs different drivers of transmission,” said Abdallah Samy, who headed the research at the KU Biodiversity Institute. “We assessed different combinations of variables to see what are the major drivers — such as climate, or socioeconomics or people’s ability to access certain areas — and in the final map we merge all the variables.”
The resulting map predicts the likelihood of Zika exposure in the coming years by segmenting Earth’s landmasses into squares of 5-by-5 kilometers each and crunching the numbers for each of them.
Multiple factors influence risk assessment because the virus can spread through contact with mosquitoes in the genus Aedes, person-to-person via sexual contact, through blood transfusions and mother-to-child during pregnancy. The study focused on mosquito-driven transmission.
“For each area, we asked, ‘Is it mosquito exposure, climate or socioeconomic variables like accessibility for people to travel from areas where Zika is endemic and spread the virus upon their return?’” said Samy, who earned a doctorate in ecology and evolutionary biology at KU in May.
The findings recently were posted to the Zika Fast Track site and published in Memórias do Instituto Oswaldo Cruz, an international journal of biological and biomedical research based in Brazil, where the current outbreak has been centered since 2015.
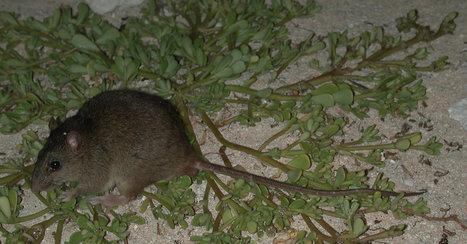
In 2014, researchers used traps and cameras to try to determine how many Bramble Cay melomys were left on a tiny outcrop in the Great Barrier Reef. They found none. Australian researchers say rising sea levels have wiped out a rodent that lived on a tiny outcrop in the Great Barrier Reef, in what they say is the first documented extinction of a mammal species due to human-caused climate change. The rodent was known to have lived only on Bramble Cay, a minuscule atoll in the northeast Torres Strait, between the Cape York Peninsula in the Australian state of Queensland and the southern shores of Papua New Guinea. The long-tailed, whiskered creature, called the Bramble Cay melomys, was considered the only mammal endemic to the Great Barrier Reef. “The key factor responsible for the death of the Bramble Cay melomys is almost certainly high tides and surging seawater, which has traveled inland across the island,” Luke Leung, a scientist from the University of Queensland who was an author of a report on the species’ apparent disappearance, said by telephone. “The seawater has destroyed the animal’s habitat and food source.” “This is the first documented extinction of a mammal because of climate change,” he said.
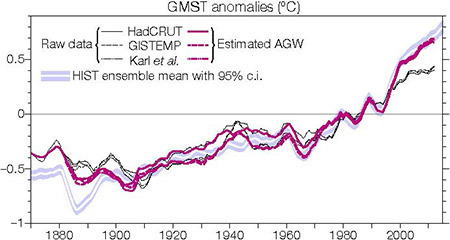
For those of us who are concerned about global warming, two of the most critical questions we ask are, “how fast is the Earth warming?” and “how much will it warm in the future?”.
The first question can be answered in a number of ways. For instance, we can actually measure the rate of energy increase in the Earth’s system (primarily through measuring changing ocean temperatures). Alternatively, we can measure changes in the net inflow of heat at the top of the atmosphere using satellites. We can also measure the rate of sea-level rise to get an estimate of the warming rate.
Since much of sea-level rise is caused by thermal expansion of water, knowledge of the water-level rise allows us to deduce the warming rate. We can also use climate models (which are sophisticated computer calculations of the Earth’s climate) or our knowledge from Earth’s past (paleoclimatology).
Many studies use combinations of these study methods to attain estimates and typically the estimates are that the planet is warming at a rate of perhaps 0.5 to 1 Watt per square meter of Earth’s surface area. However, there is some discrepancy among the actual numbers.
So assuming we know how much heat is being accumulated by the Earth, how can we predict what the future climate will be? The main tool for this is climate models (although there are other independent ways we can study the future). With climate models, we can play “what-if scenarios” and input either current conditions or hypothetical conditions and watch the Earth’s climate evolve within the simulation. Two incorrect but nevertheless consistent denial arguments are that the Earth isn’t warming and that climate models are inaccurate. A new study, published by Kevin Trenberth, Lijing Cheng, and others (I was also an author) answers these questions. The study was just published in the journal Ocean Sciences; a draft of it is available here. In this study, we did a few new things. First, we presented a new estimate of ocean heating throughout its full depth (most studies only consider the top portion of the ocean). Second, we used a new technique to learn about ocean temperature changes in areas where there are very few measurements. Finally, we used a large group of computer models to predict warming rates, and we found excellent agreement between the predictions and the measurements. According to the measurements, the Earth has gained 0.46 Watts per square meter between 1970 and 2005. Since, 1992 the rate is higher (0.75 Watts per square meter) and therefore shows an acceleration of the warming. To put this in perspective, this is the equivalent of 5,400,000,000,000 (or 5,400 billion) 60-watt light bulbs running continuously day and night. In my view, these numbers are the most accurate measurements of the rate at which the Earth is warming.
A research team including a Scripps Institution of Oceanography at the University of California San Diego climate scientist simulated in a computer model, for the first time, the realistic evolution of global mean surface temperature since 1900. In doing so, the researchers also created a new method by which researchers can measure and monitor the pace of anthropogenic global warming, finding that the contribution of human activities to warming in the surface waters of the Pacific Ocean can be distinguished from natural variability. Former Scripps researcher Yu Kosaka, now at the University of Tokyo, and Shang-Ping Xie, the Roger Revelle Chair in Environmental Science at Scripps, created the simulation by forcing sea surface temperature over the tropical Pacific to follow the observed variability. “The climate system includes naturally occurring cycles that complicate the measurement of global warming due to the anthropogenic increase in atmospheric greenhouse gases,” said Xie. “We can isolate the anthropogenic warming by removing the internally generated natural variability.” Climate policymakers have sought to limit the rise of global temperatures to 2° Celsius higher than pre-industrial levels. That figure is considered a threshold beyond which society and natural systems are virtually assured of experiencing significant and dangerous instability. Scientists have estimated that the planet is already roughly 1°C warmer at the surface than before the Industrial Revolution. The 2° C target was reaffirmed during the 2015 Conference of the Parties, known as COP21, that was held in Paris in December. Kosaka and Xie’s research could provide an easily generated and more accurate means to measure society’s success in keeping temperatures below that threshold. The research is further confirmation of the primary importance of the Pacific in controlling global-scale climate that researchers have come to understand in recent decades. Kosaka and Xie plotted the rise of global mean temperatures over the past 120 years. The rise of temperatures ascends in a staircase fashion with the steps becoming larger over the past 50 years.
More than 100 Nobel laureates have signed a letter urging Greenpeace to end its opposition to genetically modified organisms (GMOs). The letter asks Greenpeace to cease its efforts to block introduction of a genetically engineered strain of rice that supporters say could reduce Vitamin-A deficiencies causing blindness and death in children in the developing world. "We urge Greenpeace and its supporters to re-examine the experience of farmers and consumers worldwide with crops and foods improved through biotechnology, recognize the findings of authoritative scientific bodies and regulatory agencies, and abandon their campaign against 'GMOs' in general and Golden Rice in particular," the letter states. The letter campaign was organized by Richard Roberts, chief scientific officer of New England Biolabs and, with Phillip Sharp, the winner of the 1993 Nobel Prize in physiology or medicine for the discovery of genetic sequences known as introns. The campaign has a website, supportprecisionagriculture.org, that includes a running list of the signatories, and the group plans to hold a news conference Thursday morning at the National Press Club in Washington. “We’re scientists. We understand the logic of science. It's easy to see what Greenpeace is doing is damaging and is anti-science," Roberts told The Washington Post. “Greenpeace initially, and then some of their allies, deliberately went out of their way to scare people. It was a way for them to raise money for their cause." Roberts said he endorses many other activities of Greenpeace, and said he hopes the group, after reading the letter, would "admit that this is an issue that they got wrong and focus on the stuff that they do well."
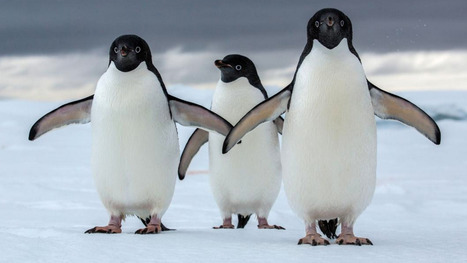
A new study finds significant impact, and a possible silver lining, for the iconic birds over the next century. Adélie penguins (Pygoscelis adeliae) have survived in Antarctica for nearly 45,000 years, adapting to glacial expansions and sea ice fluctuations driven by millennia of climatic changes. The penguins remained resilient through these changes, but new research from the University of Delaware suggests that unique 21st-century climates may pose an existential threat to many of the colonies on the Antarctic continent. Published Wednesday in Scientific Reports, the study, led by oceanographer Megan Cimino, found that up to 60 percent of the current Adélie penguin habitat in Antarctica could be unfit to host colonies by the end of the century. The Adélie penguin is one of two true Antarctic penguins—the other being the emperor penguin (Aptenodytes forsteri)—and it inhabits the full extent of the continent. The penguins nest on land during the austral (southern) summer, and migrate during the winter to the edge of the sea ice, where they are able to feed at sea. Using a combination of field survey data and high-resolution satellite imagery, the researchers were able to stitch together 30 years of colony data, from 1981 to 2010, at sites ringing Antarctica. Looking at the year-to-year data, the researchers were able to identify population trends at each colony site for the full 30-year period. The scientists found diverging trends at different sites. Some colonies, like the closely monitored population near Palmer Station, a United States research hub in northern Antarctica, saw declines of over 80 percent.
A new approach to gas exploration has discovered a huge helium gas field, which could address the increasingly critical shortage of this vital yet rare element. Helium doesn't just make your voice squeaky - it is critical to many things we take for granted, including MRI scanners in medicine, welding, industrial leak detection and nuclear energy. However, known reserves are quickly running out. Until now helium has never been found intentionally - being accidentally discovered in small quantities during oil and gas drilling. Now, a research group from Oxford and Durham universities, working with Helium One, a helium exploration company headquartered in Norway, has developed a brand new exploration approach. The first use of this method has resulted in the discovery of a world-class helium gas field in Tanzania. Their research shows that volcanic activity provides the intense heat necessary to release the gas from ancient, helium-bearing rocks. Within the Tanzanian East African Rift Valley, volcanoes have released helium from ancient deep rocks and have trapped this helium in shallower gas fields. The research is being presented by Durham University PhD student Diveena Danabalan at the Goldschmidt geochemistry conference in Yokohama, Japan. Diveena Danabalan, of Durham University's Department of Earth Sciences, said: "We show that volcanoes in the Rift play an important role in the formation of viable helium reserves. Volcanic activity likely provides the heat necessary to release the helium accumulated in ancient crustal rocks. However, if gas traps are located too close to a given volcano, they run the risk of helium being heavily diluted by volcanic gases such as carbon dioxide, just as we see in thermal springs from the region. We are now working to identify the 'goldilocks-zone' between the ancient crust and the modern volcanoes where the balance between helium release and volcanic dilution is 'just right'." Prof. Chris Ballentine, Department of Earth Sciences, University of Oxford, said: "We sampled helium gas (and nitrogen) just bubbling out of the ground in the Tanzanian East African Rift valley. By combining our understanding of helium geochemistry with seismic images of gas trapping structures, independent experts have calculated a probable resource of 54 Billion Cubic Feet (BCf) in just one part of the rift valley. This is enough to fill over 1.2 million medical MRI scanners. To put this discovery into perspective, global consumption of helium is about 8 BCf per year and the United States Federal Helium Reserve, which is the world's largest supplier, has a current reserve of just 24.2 BCf. Total known reserves in the USA are around 153 BCf. This is a game changer for the future security of society's helium needs and similar finds in the future may not be far away."
Via Mariaschnee
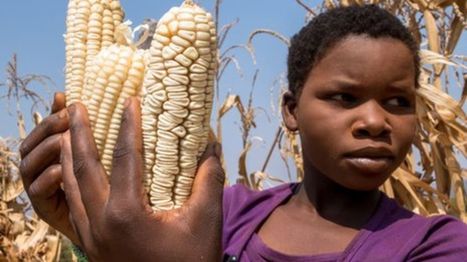
Temperatures around the world are rising faster than scientists can develop varieties that can cope with a warmer world, according to a new study. Crops yields around the world could fall within a decade unless action is taken to speed up the introduction of new varieties. A study says temperatures are rising faster than the development of crop varieties that can cope with a warmer world. In Africa, researchers found that it can take 10-30 years before farmers can grow a new breed of maize. By the time these new crops are planted, they face a warmer environment than they were developed in. The scientists behind the study, published in the journal Nature Climate Change, looked closely at the impact of temperature rises on crop duration - that's the length of time between planting and harvesting. They found that in a warmer world durations will be shorter meaning these varieties will have less time to accumulate biomass and yields could be affected. In their paper, the researchers write that crop duration will become significantly shorter as early as 2018 in some regions but by 2031, the majority of maize-growing areas of Africa will be affected. "The actual changes in yield may be different but this effect is there, the impact of this change in duration will occur unless breeding changes," said lead author Prof Andy Challinor from the University of Leeds. "The durations will be shorter than what they were bred for - by the time they are in the field they are, in terms of temperature, out of date." New varieties of maize need between 10-30 years of development before they are ready to be grown by farmers. The scientists say the lag is down to a combination of factors including the limited number of crops you can grow in a season, the need for government approved testing and there are also a number of problems of access to markets that can increase the time it takes before the farmers have the new seeds to plant. Increasing the speed of development is important but according to Prof Challinor, so is making smarter assumptions about future conditions.
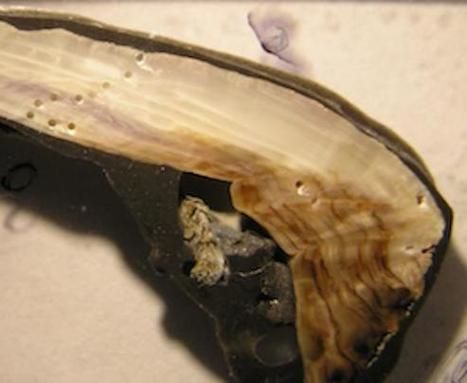
Shells of California mussels collected from the Pacific Ocean off the coast of Washington in the 1970s are on average 32 percent thicker than modern specimens, according to a new study published by University of Chicago biologists. Shells collected by Native Americans 1,000 to 1,300 years ago were also 27 percent thicker than modern shells, on average. The decreasing thickness over time, in particular the last few decades, is likely due to ocean acidification as a result of increased carbon in the atmosphere. "Archival material provided by past researchers, the Makah Tribal Nation, and the Olympic National Park allowed us to document this intriguing and concerning pattern in shell thickness," said Cathy Pfister, PhD, professor of ecology and evolution at the University of Chicago and lead author. The study was published June 15, 2016, in theProceedings of the Royal Society B. As humans burn fossils fuels, the oceans absorb a large portion of the additional carbon released into the atmosphere. This in turn causes pH levels of ocean water to drop, making it more acidic. Mussels, oysters, and certain species of algae have difficulty producing their calcium carbonate shells and skeletons in such an environment, and can provide an early indicator of how increasing ocean acidification affects marine life. In previous studies, Pfister and her colleagues documented declining pH levels in the waters surrounding Tatoosh Island off the coast of Washington state. In 2011 they further analyzed carbon and oxygen isotopes taken from modern mussel shells, shells collected by the local Makah tribe between AD 668 and 1008, and shells collected by biologists in the 1970s.
More than 80% of the world's population lives under light-polluted skies, a study suggests. Scientists explain in Science Advances how ground measurements and satellite data were used to create an atlas of a world brightened by artificial lights. It reveals that the population of Singapore, Kuwait and Qatar experience the brightest night skies. Conversely, people living in Chad, Central African Republic and Madagascar are least affected by light pollution. Dr Christopher Kyba, from the German Research Centre for Geosciences in Potsdam, said: "The artificial light in our environment is coming from a lot of different things. "Street lights are a really important component, but we also have lights from our windows in our homes and businesses, from the headlights of our cars and illuminated billboards."
|
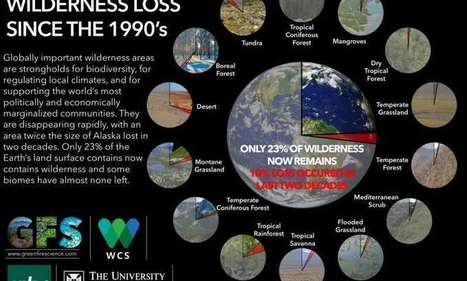
Researchers reporting in the journal Current Biology show catastrophic declines in wilderness areas around the world over the last 20 years. They demonstrate alarming losses comprising a tenth of global wilderness since the 1990s - an area twice the size of Alaska and half the size of the Amazon. The Amazon and Central Africa have been hardest hit. The findings underscore an immediate need for international policies to recognize the value of wilderness areas and to address the unprecedented threats they face, the researchers say. "Globally important wilderness areas—despite being strongholds for endangered biodiversity, for buffering and regulating local climates, and for supporting many of the world's most politically and economically marginalized communities—are completely ignored in environmental policy," says Dr James Watson of the University of Queensland in Australia and the Wildlife Conservation Society in New York. "Without any policies to protect these areas, they are falling victim to widespread development. We probably have one to two decades to turn this around. International policy mechanisms must recognize the actions needed to maintain wilderness areas before it is too late. We probably have one to two decades to turn this around." Watson says much policy attention has been paid to the loss of species, but comparatively little was known about larger-scale losses of entire ecosystems, especially wilderness areas which tend to be relatively understudied. To fill that gap, the researchers mapped wilderness areas around the globe, with "wilderness" being defined as biologically and ecologically intact landscapes free of any significant human disturbance. The researchers then compared their current map of wilderness to one produced by the same methods in the early 1990s. This comparison showed that a total of 30.1 million km2 (around 20 percent of the world's land area) now remains as wilderness, with the majority being located in North America, North Asia, North Africa, and the Australian continent. However, comparisons between the two maps show that an estimated 3.3 million km2 (almost 10 percent) of wilderness area has been lost in the intervening years. Those losses have occurred primarily in South America, which has experienced a 30 percent decline in wilderness, and Africa, which has experienced a 14 percent loss.
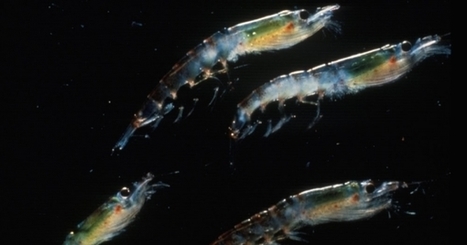
They may be small, but krill — tiny, shrimp-like creatures — play a big role in the Antarctic food chain. As climate change warms the Southern Ocean and alters sea ice patterns, though, the area of Antarctic water suitable for krill to hatch and grow could drop precipitously, a new study finds. Most Antarctic krill are found in an area from the Weddell Sea to the waters around the Antarctic Peninsula, the finger of land that juts up toward South America. They serve as an important source of food for various species of whales, seals and penguins. While those animals find other food sources during lean years, it is unclear if those alternate sources are sustainable long-term. Over the past 40 years, populations of adult Antarctic krill have declined by 70 to 80 percent in those areas, though researchers debate whether that drop is due to the effects of climate change, a rebound in whale populations after the end of commercial whaling or some combination of those pressures. Because of its key role in the regional food chain, scientists are concerned about the impacts that future climate change may have on the krill population and the larger Antarctic ecosystem. In the new study published in the journal Geophysical Research Letters, Andrea Piñones and Alexey Fedorov examined how expected changes in ocean temperatures and sea ice coverage might affect krill during their earliest life stages when they are most vulnerable to environmental conditions. Krill has a complex, regimented life cycle that requires a delicate balance of conditions. Female krill lay their eggs in the upper ocean during summer; those eggs then sink to where the water is in the right temperature range for them to hatch. Once they hatch, the krill larvae swim back to the surface waters where they must find food, in the form of phytoplankton, within 10 days or they will die. The larvae must then eat enough food during the late summer and fall to fatten up before winter. To survive that winter, they also need sea ice to form by a certain time, as they use it for shelter, as well as feeding on the algae that dwells in the nooks and crannies of the ice. “Even if there is a lot of a sea ice, if the sea ice is not there at the time that they need, they don’t survive,” said Piñones, who has dual appointments at the Center for Advanced Studies in Arid Zones and the High Latitude Marine Ecosystem Dynamic Center in Chile. Piñones and Fedorov, who works at Yale University, took a krill growth model and plugged in expected ocean temperature rise from climate models, projections of how sea ice area and the timing of its growth and melt might change, and possible changes in phytoplankton to see how those changes impacted the krill during its early life stages.
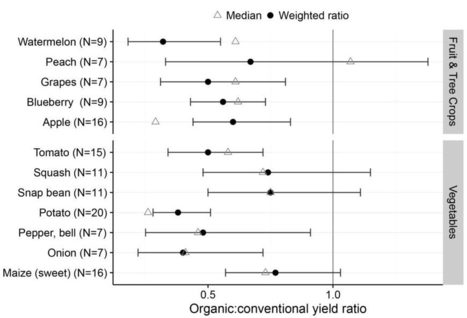
People buy organic food for many different reasons, most of which are factually incorrect. Quite possibly the biggest myth about organic food is that it is grown without pesticides. That is simply untrue. Others have been led to believe that organic food is healthier and tastier* than conventionally grown food. Those myths have also been busted. Another justification for organic food is that it is more sustainable and environmentally friendly. Those myths, too, already have been exposed, but a new paper inPLoS ONE puts another nail into the coffin. The authors obtained data from crop yield surveys conducted by the USDA in 2014. To control for the influence of geography, they paired the data so that crop yields could only be compared for farmers who lived in the same state. (For example, organic grape growers in Washington State could only be compared with conventional grape growers who also farmed in Washington.) What did they find? As suspected, organic farms are not as productive as conventional ones. In fact, the overall average is that organic farming produces 20% fewer crops.
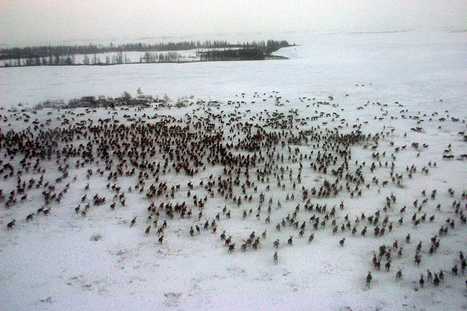
First a heatwave hit Siberia. Then came the anthrax. Temperatures have soared in western Russia’s Yamal tundra this summer. Across Siberia, some provinces warmed an additional 10 degrees Fahrenheit beyond normal. In the fields, large bubbles of vegetation appeared above the melting permafrost — strange pockets of methane or, more likely, water. Record fires blazed through dry Russian grassland. In one of the more unusual symptoms of unseasonable warmth, long-dormant bacteria appear to be active. For the first time since 1941, anthrax struck western Siberia. Thirteen Yamal nomads were hospitalized, including four children, the Siberian Times reported. The bacteria took an even worse toll on wildlife, claiming some 1,500 reindeer since Sunday. According to NBC News, the outbreak is thought to stem from a reindeer carcass that died in the plague 75 years ago. As the old flesh thawed, the bacteria once again became active. The disease tore through the reindeer herds, prompting the relocation of dozens of the indigenous Nenet community. Herders face a quarantine that may last until September. The governor, Dmitry Kobylkin, declared a state of emergency. On Tuesday, Kobylkin said “all measures” had been taken to isolate the area, according to AP. “Now the most important thing is the safety and health of our fellow countrymen — the reindeer herders and specialists involved in the quarantine.”
The extinction of most of the world’s remaining megafauna mammals is more or less imminent (over the next few decades) without major changes and improved conservation strategies, according to a public declaration published in the journal BioScience. The public declaration — which calls for a coordinated global plan to prevent further megafauna extinctions — was signed by over 40 conservation researchers and experts. The main drivers behind this rapid slide towards mass megafauna extinctions are the same ones that have been in play for centuries and millennia now — the expansion of agriculture and livestock grazing, the attendant wild habitat loss, deforestation, and over-hunting often owing to demand from the wealthy; i.e., as with the extinction of the European lion during the growth days of the Roman Republic/Empire owing to a demand for lion pelts. “The more I look at the trends facing the world’s largest terrestrial mammals, the more concerned I am we could lose these animals just as science is discovering how important they are to ecosystems and to the services they provide for people,” stated Dr William Ripple, professor of ecology at Oregon State University and lead author of the study. Roughly 59% of the world’s biggest mammalian carnivore species, and 60% of the largest herbivores, are now categorized as being threatened with extinction, according to the International Union for Conservation of Nature’s Red List of Threatened Species. These animals are of license vitally important to the ecosystems and regions in which they live — the loss of large herds of migrating herbivores is associated with vastly increased rates of desertification in dry-land regions; the loss of large carnivores with attendant ecosystem collapses owing to lack of predators; etc. “The loss of elephants in the forests of Central Africa is increasingly damaging the function of the region’s most important ecosystems,” noted WCS Conservation Scientist Dr Fiona Maisels, one of the study’s co-authors. “We’re only beginning to understand how vital these keystone species are to the health of rainforests and other species that inhabit them.” The press release notes that the paper “includes a 13-part declaration that highlights the need to acknowledge the threatened status of many large mammals and the vital ecological roles they play.
After 2014 set the record for annual average global surface temperature, 2015 promptly smashed it. By the end of 2015, the incredibly strong El Niño that had developed to help fuel that record enabled climate scientists to predict that 2016 was almost certain to break the record again. With the first half of 2016’s temperatures in the books, this prediction is proving to be on target. In a press conference Tuesday, NASA scientists highlighted the standout temperatures we've seen so far in 2016. This has been, far and away, the warmest January-to-June period on record. Even though the El Niño event has now come to an end, with forecasts pointing to cooler La Niña waters in the eastern equatorial Pacific Ocean, 2016 is a virtual lock to be significantly warmer than 2015. June 2016 also set the record for the warmest temperature on record in June—the 8th straight month that this has happened. The early expectation for 2017, however, is that the developing neutral or La Niña conditions will put an end to the streak of record years. The El Niño/La Niña see-saw is a an important factor in the year-to-year variability of global temperature, but it's obviously taking place on top of the long-term warming trend driven by human activities. Every year, an El Niño is capable of pushing average global temperatures a little higher than it could the year before. NASA’s Gavin Schmidt estimated that only about 40 percent of 2016’s increase over 2015 can be blamed on El Niño conditions. Meanwhile, Arctic sea ice is also having an interesting year. The extent of Arctic sea ice has been at or near a record low all year long. That's due to weather—warm temperatures (especially an early start to the melt season) and winds conducive to dispersing the ice pack. So will 2016 break 2012’s record for the lowest Arctic sea ice extent at the end of the melt season in September? NASA’s Walt Meier cautioned that while it’s certainly likely to be low—also following the longer-term trend—we have a couple months of weather yet that will determine the final result. “The first six months certainly have primed things to potentially be a record, but the summer melt season [from June to August] is really crucial. It really depends a lot on what happens there,” Meier said.
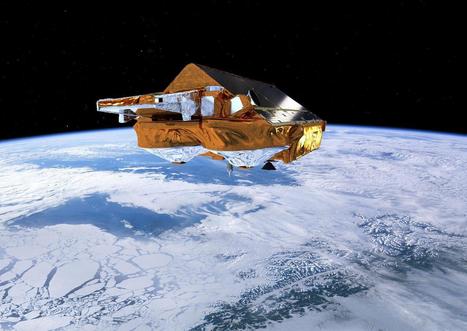
In the most detailed picture to date, information from ESA's CryoSat satellite reveals how melting ice in Greenland has recently contributed twice as much to sea-level rise as the prior two decades. Between 2011 and 2014, Greenland lost around one trillion tonnes of ice. This corresponds to a 0.75 mm contribution to global sea-level rise each year – about twice the average of the preceding two decades. The study, published in Geophysical Research Letters today, combines data from the CryoSat mission with a regional climate model to map changes in Greenland ice-sheet mass. It is the most detailed recent picture of ice loss from Greenland. CryoSat carries a radar altimeter that can measure the surface height variation of ice in fine detail, allowing scientists to record changes in its volume with unprecedented accuracy. The study demonstrates how the satellite has allowed researchers to map the complex regional pattern of imbalance. "CryoSat's radar really brings into focus our view of the ice sheet, revealing which glaciers are exhibiting the greatest signs of change," explained lead author Dr Mal McMillan from the UK Centre for Polar Observation and Modelling at the University of Leeds. "This helps us to study Greenland's individual outlet glaciers, which in turn allows us to better understand the contribution they have made to global sea-level rise."
Because Volkswagen has committed large-scale fraud with the software in diesel engines, nine million fraudulent cars, sold in Europe and the US from 2009 to 2015, have emitted a cumulative amount of 526 kilo tons of nitrogen oxides more than was legally allowed. The Volkswagen fraud has had an even larger environmental impact in Europe than in the US: more Volkswagens were sold and the population density is higher. Environmental scientists from Radboud University in the Netherlands have provided an estimate of the public health consequences caused by this fraud in the scientific magazineEnvironmental Pollution. According to the calculations of Rik Oldenkamp, Rosalie van Zelm and Mark Huijbregts, 45,000 life years were lost due to ill-health or early death, of which over 44,000 in Europe (and almost 700 in the United States) are associated with inhalation of fine dust due to the extra nitrogen oxides emitted by the diesel cars that where tampered with. If Volkswagen does not recall the cars that were tampered with, another 72,000 healthy life years will be lost in Europe due to the above-mentioned emissions. Aside from 'healthy life years', there is another commonly used way to calculate damage, based on the value of statistical life (VSL). This measure of costs reflects the rate at which an individual would trade consumption of other goods and services for small changes in her own mortality risk, given her preferences and budget constraints. Researchers from Nijmegen have calculated these specific health costs due to mortality in Europe and the United States to be at least 39 billion US dollars, which is significantly more than the 7.3 billion US dollars that Volkswagen Group has set aside to cover worldwide costs related to the diesel emissions scandal. Using this method of damage calculation, one should take into account another 62 billion US dollars in damage if Volkswagen does not recall their cars.
Scientists find evidence that the hole is finally shrinking, thanks to the phase out of harmful chemicals 30 years ago. After three decades of observation, scientists have finally found the first fingerprints of healing in the notorious Southern Hemisphere ozone hole. In 1974, Mario Molina and Sherwood Rowland, two chemists at the University of California, Irvine, published an article in Nature detailing the threats to the ozone layer from chlorofluorocarbon (CFC) gases. At the time, CFCs were commonly used in spray bottles and as coolants in many refrigerators, and they were rapidly accumulating in the atmosphere. The groundbreaking research—for which they were awarded the 1995 Nobel Prize in chemistry—concluded that the atmosphere only had a “finite capacity for absorbing chlorine” atoms in the stratosphere. After being widely attacked by the chemical industry, Molina and Rowland’s work was vindicated 11 years later, in 1985, when a team of English scientists realized the dire implications of their findings: the CFCs in the atmosphere had created a hole in the ozone layer. The loss of the protective ozone can lead to increased rates of skin cancer in humans and animals. The research team, led by Susan Solomon, a professor of atmospheric chemistry and climate science at MIT, found multiple lines of evidence for the healing. The findings were published Thursday in Science. The ozone hole forms every year over Antarctica, beginning in August and generally peaking in October. Solomon's team compared September ozone measurements, collected from balloon data and satellites, with statistical simulations that predict ozone. Solomon’s team found that, in recent years, the hole is not eclipsing the 12-million-square-kilometer threshold until later in the southern spring, which indicates that the September hole is shrinking. In fact, the researchers believe the ozone hole has shrunk by more than 4 million square kilometers. Furthermore, the hole is not as deep as it used to be.
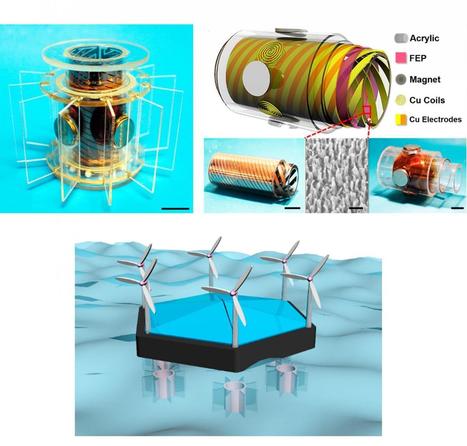
Energy from the ocean, or "blue energy," is arguably the most underexploited power source, according to researchers in a new study. The main problem is that ocean waves are irregular and pass by at low frequencies, whereas most energy harvesters operate best with waves that have regular amplitudes and high frequencies. Unfortunately, the calming lull of slow, unpredictable waves beating against the shore that we tend to find so peaceful is not ideal for energy harvesting. In a new study published in ACS Nano, a team of researchers led by Zhong Lin Wang at the Georgia Institute of Technology has developed a device that can harvest ocean waves in a very broad frequency range that encompasses almost all of the ocean wave energy spectrum, including the hard-to-reach low frequencies that are inaccessible to most harvesters. The new device is a hybrid system that consists of two generators. An electromagnetic generator (EMG), which has traditionally been the main approach for harvesting ocean energy, is well-suited for harvesting waves at high frequencies and fast rotation speeds. A triboelectric nanogenerator (TENG), which has only recently been investigated for ocean energy applications, works better in the low-frequency range and at slower rotation speeds. "The TENG has the unique advantage of high output voltage, and its output power is linearly scaled with frequency, making it ideal for harvesting low-frequency energy," Wang told Phys.org. "On the other hand, the EMG's output power is proportional to the square of the frequency, so the EMG is ideally suited for harvesting high-frequency energy. At low frequency, (< 5 Hz), the effective output of the TENG is much higher than that of the EMG." When combined, the two types of generators operate in a broad frequency range and in two modes (fluctuation and rotation), allowing the hybrid device to collect a variety of types of ocean energies, including wave, current, and tidal. Each type of energy causes a different motion that requires a flexible harvesting capability. The researchers demonstrated the device by using it to light up LEDs that form the words "BLUE ENERGY." The EMG is connected to the word "BLUE" and the TENG is connected to the word "ENERGY" so that the power output of each generator can be viewed individually.
Via THE OFFICIAL ANDREASCY
It is fairly well understood by now that releasing carbon dioxide and other greenhouse gases into the atmosphere imposes an economic cost, in the form of climate change impacts. In most cases, however, those responsible for carbon emissions are not required to pay that cost. Instead, it's borne mainly by the world's poor and low-lying countries, and of course by future generations, as many of the worst impacts of climate change will emerge years after the emissions that drive them. People sometimes refer to the unpaid cost of carbon pollution as a subsidy, or an "implicit subsidy," to polluting businesses. The IMF recently issued a report saying that total worldwide subsidies to energy, mainly fossil fuel energy, amounted to $5.2 trillion a year. The reason that number is so high is that the IMF includes implicit subsidies — the social costs imposed by businesses (including climate damages) that they don't have to pay for. Vox's Brad Plumer raised some questions about whether that's a misleading use of the term "subsidy." Whatever you call it, though, it makes for an unsustainable situation, literally. It can't go on. As climate change gets worse and the chance to avoid harsh impacts dwindles, governments are getting serious about putting some sort of price on carbon emissions, whether explicit (a tax) or implicit (regulations). Soon, a quarter of the world's carbon emissions will be priced in some way. Businesses that now emit carbon pollution for free (or cheap) will soon see their costs rise. In other words, carbon pollution is a business risk. It's a bubble that's going to pop, probably soon. The Carbon Tracker Initiative has popularized a term for this looming liability: "unburnable carbon." There's been a lot of work recently trying to quantify carbon risk. A recent contribution to that conversation was released by Chris Hope and colleagues at the University of Cambridge Judge Business School: "Quantifying the implicit climate subsidy received by leading fossil fuel companies." It attempts to put a number on the carbon risk facing the world's top 20 fossil fuel companies, the ones most directly vulnerable to a price on carbon. The results suggest that those companies are in a perilous situation. Hope took a fairly simple approach: He multiplied the carbon emissions embedded in the companies' products by the "social cost of carbon," i.e., the net economic, health, and environmental cost of a ton of carbon dioxide. He ran the calculation for data from 2008 to 2012 and took the results as a rough proxy for the level of carbon risk facing each company. (See the technical addendum below for more details on this calculation.) The results are pretty startling. To wit: "For all companies and all years, the economic cost to society of their CO2 emissions was greater than their after‐tax profit, with the single exception of Exxon Mobil in 2008" (my emphasis). In other words, if these fossil fuel companies had to pay the full cost of the carbon emissions produced by their products, none of them would be profitable. It's even worse for pure coal companies, for which "the economic cost to society exceeds total revenue in all years, with this cost varying between nearly $2 and nearly $9 per $1 of revenue." Total revenue, Hope and colleagues note, represents "employment, taxes, supply purchases, and indirect employment" — everything that coal companies contribute to the economy. It turns out the costs they impose through carbon emissions are larger than all those contributions combined. (For oil and gas companies, carbon costs generally range from 10 to 50 percent of total revenue.)
For the first time, an international team of scientists from the European Society for Translational Antiviral Research (ESAR) has mapped the spread of the HIV virus around the globe after it reached the United States in the early 1970s. The major study, published in the Journal of Molecular Epidemiology and Evolutionary Genetics of Infectious Diseases (MEEGID), finds that HIV travelled from the US to Western Europe on a number of occasions, whereas Central and Eastern Europe remained isolated for the most part of the early epidemic. Analysis of thousands of genome sequences shows that geopolitical events such as the fall of the Iron Curtain had a big impact on human migration patterns within Europe and thus the spread of the virus through the continent. Co-lead author Dr Gkikas Magiorkinis, of the Department of Zoology at Oxford University, said: 'The story of HIV up to its arrival in the US is already known. What happened after that, however, has been unclear. We wanted to see how HIV spread in the Western world. 'One of our main findings is that North America was spreading the virus much more than importing it, whereas Europe was absorbing the infection.' Co-lead author Assistant Professor Dimitrios Paraskevis, of the Department of Hygiene, Epidemiology and Medical Statistics at the National and Kapodistrian University of Athens, said: 'Another striking finding is the clear segregation between Eastern and Western Europe in the early days of the virus, which probably has to do with the political situation on the continent. These distinct strains in Eastern and Western Europe were able to connect again in the 1990s once movement became less curtailed.' Human immunodeficiency virus type 1 (HIV-1) was discovered in the early 1980s, when the virus had already established a pandemic. For at least three decades the epidemic in the Western world has been dominated by subtype B infections as part of a sub-epidemic that travelled from Africa through Haiti to the US. However, the pattern of the subsequent spread still remains poorly understood. The researchers analysed almost 9,000 genomes of globally representative HIV-1 subtype B strains to map their spread around the world over the past 50 years and to highlight any significant spread patterns. They show that subtype B travelled from North America to Western Europe on different occasions, while Central and Eastern Europe remained isolated for the most part of the early epidemic. Looking at Europe in more detail, the study shows that the UK, France and Switzerland all exchanged viral isolates more often with non-European countries than with European ones. The observed pattern is likely to mirror geopolitical landmarks in the post-World War II era – namely, the rise and fall of the Iron Curtain – and traditional links between countries as a result of European colonialism. HIV-1 therefore spread along specific migration routes that are consistent with geopolitical factors that affected human activities during the past 50 years, such as migration, tourism and trade. The researchers say their findings support the argument that epidemic control policies should be global and incorporate political and socioeconomic factors.
|